Multifamily Housing
443 West Wheatland Road Dallas, TX 75232
443 West Wheatland Road Dallas, TX 75232

Details & Description
Property Highlights
- • 100% Classic Units
- • Currently All Bills Paid
- • Average unit size: 810 SF
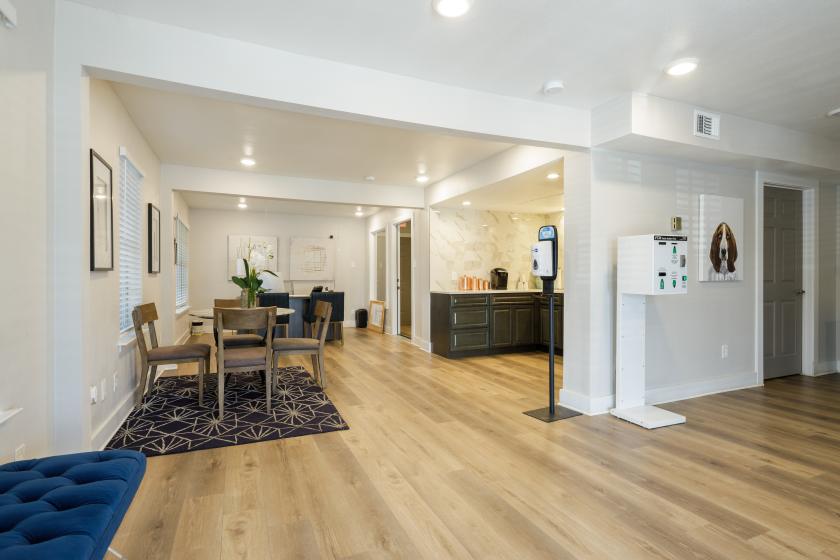
Additional Photos


Listing Agents

Jaxx Davies
O: 214-979-6114
M: 602-885-3336
jaxx.davies@cbre.com
O: 214-979-6114
M: 602-885-3336
jaxx.davies@cbre.com
Chris Deuillet
chris.deuillet@cbre.com
chris.deuillet@cbre.com
While we strive to provide the most accurate information, all listing information, and demographic data, is provided by third-parties. As such, MyEListing will not be responsible for the accuracy of the information. It is strongly recommended that you verify all information with the listing agent, and any relevant agencies, prior to making any decisions.


