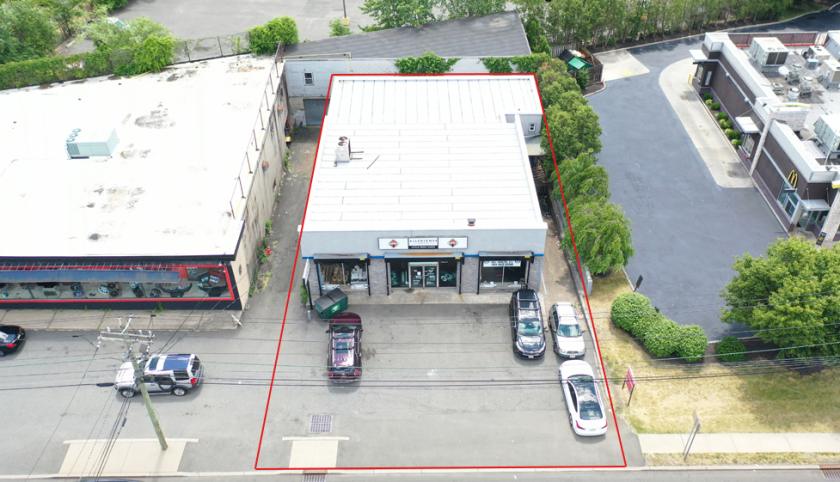
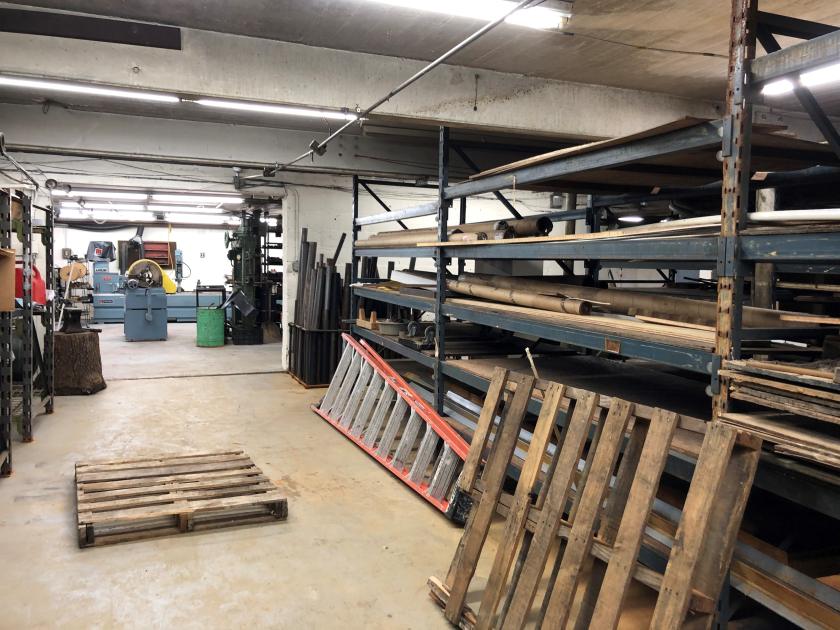
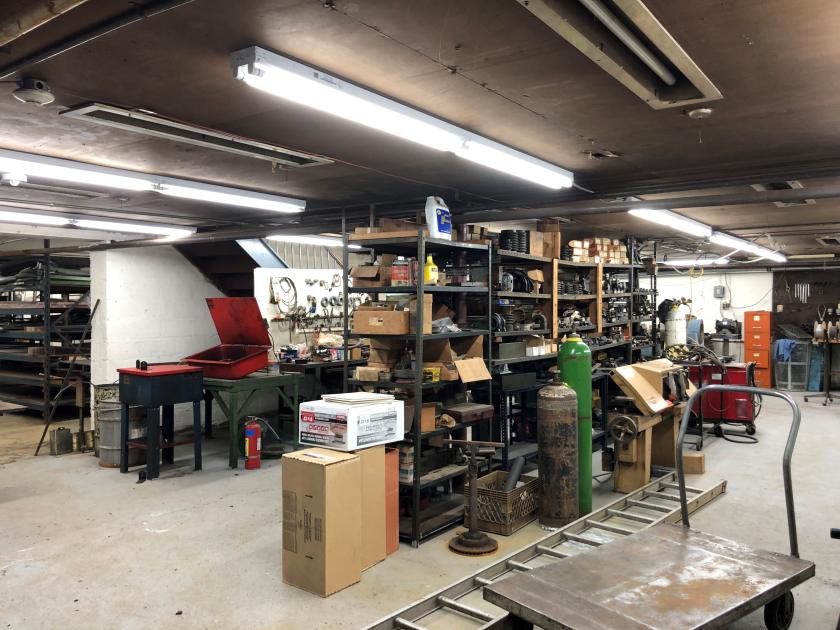
±4,000 SF Retail (1st Floor) and ±4,000 SF Warehouse / Storeroom (2nd Floor)
1 Platform Loading Position
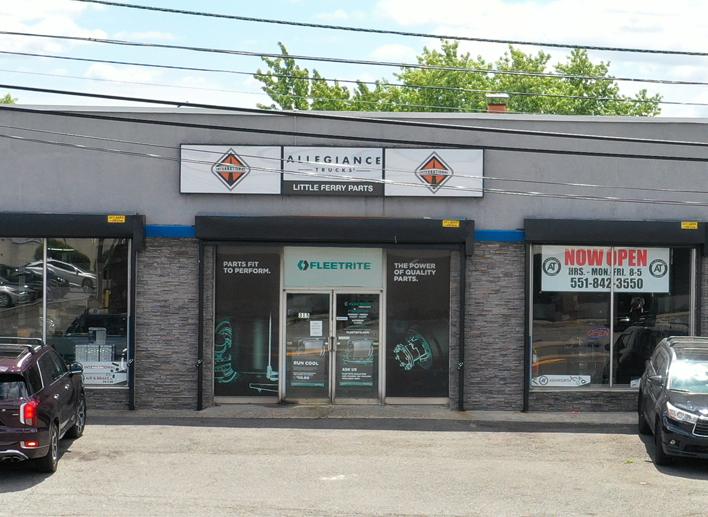
Former Auto / Truck Parts Retailer
Lot Size at 0.16 AC (Block 14, Lot 3.02)
Taxes at $12,184.02 (2023)
1 Mile to Teterboro Airport
Approx. 2.3 Miles to I-80
Approx. 2.6 Miles to NJ Turnpike
Approx. 5.3 Miles to George Washington Bridge
Approx. 11.6 Miles to Lincoln Tunnel
Approx. 12 Miles to Holland Tunnel
Approx. 18.5 Miles to Newark Liberty International Airport
No part of this information may be copied, reproduced, repurposed, or screen-captured for any commercial purpose without prior written authorization from MyEListing.
While we strive to provide the most accurate information, all listing information, and demographic data, is provided by third-parties. As such, MyEListing will not be responsible for the accuracy of the information. It is strongly recommended that you verify all information with the listing agent, and any relevant agencies, prior to making any decisions.
What is the asking price for 315 U.S. 46 in Little Ferry?
The asking price for 315 U.S. 46 is $12.50 a SF per Year
What is the building size of this commercial Retail property?
The size of this lease property at '.315 U.S. 46.' is 8000 square feet
What kind of Retail is the propery at 315 U.S. 46?
The property at 315 U.S. 46 Little Ferry, NJ 07643 is listed as a Other Retail Retail property
What is the population within 1 mile of 315 U.S. 46 in Little Ferry?
The population within 1 mile of 315 U.S. 46 Little Ferry, NJ 07643 is 16,037 people.
Who do I contact for questions about 315 U.S. 46?
You should contact the listing agent,
Jason M. Crimmins , for any details regarding this commercial listing.