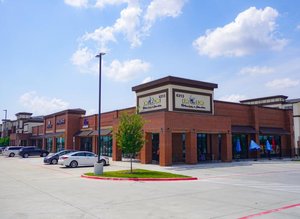
1-Mile | 3-Miles | 5-Miles | ||
---|---|---|---|---|
Total Population | 8,739 | 91,111 | 255,601 | |
Population Median Age | 42 | 37 | 35 | |
Population by Age | 0-9 Yrs | 323 (3%) | 9225 (10%) | 33763 (13%) |
10-19 Yrs | 504 (5%) | 11220 (12%) | 37422 (14%) | |
20-29 Yrs | 2311 (26%) | 19185 (21%) | 45998 (17%) | |
30-39 Yrs | 1762 (20%) | 14727 (16%) | 37955 (14%) | |
40-49 Yrs | 782 (8%) | 10248 (11%) | 29346 (11%) | |
50-59 Yrs | 728 (8%) | 9759 (10%) | 27947 (10%) | |
60-69 Yrs | 1098 (12%) | 9028 (9%) | 23025 (9%) | |
70+ Yrs | 1230 (14%) | 7719 (8%) | 20145 (7%) | |
Median HH Income | $76,366 | $64,594 | $55,016 | |
Total Household Income | < 24K | 863 (17%) | 6968 (19%) | 20223 (22%) |
25-49K | 768 (15%) | 7326 (20%) | 21391 (23%) | |
50-74K | 867 (17%) | 6402 (17%) | 17451 (19%) | |
75-99K | 616 (12%) | 4368 (12%) | 10551 (11%) | |
100-199K | 1201 (23%) | 6989 (19%) | 14073 (15%) | |
200K+ | 749 (14%) | 3708 (10%) | 6588 (7%) | |
Highest Education Level | No Diploma | 546 | 12186 | 43327 |
Diploma or GED | 881 | 12442 | 39549 | |
Some College | 755 | 9049 | 24659 | |
Assoc. Degree | 407 | 2869 | 7407 | |
Bachelors Degree | 2651 | 15464 | 29217 | |
Higher Degree | 1728 | 9818 | 17780 | |
Total Housing Units | 5,810 | 40,762 | 101,778 | |
--Owner-Occupied | 1,692 | 16,717 | 45,350 | |
--Renter-Occupied | 3,372 | 19,043 | 44,927 | |
Owner-Occupied Values | < 100K | 51 | 3658 | 15081 |
100-199K | 125 | 3438 | 12409 | |
200-299K | 333 | 2363 | 4753 | |
300-399K | 340 | 2137 | 3995 | |
400-499K | 350 | 1580 | 2757 | |
500K+ | 493 | 3541 | 6355 | |
Total Working Age Population | 8,147 | 76,217 | 200,821 | |
In Work Force | 5,440 | 46,695 | 125,256 | |
Not In Work Force | 2,707 | 29,522 | 75,565 | |
Workforce Employed | 5,356 | 44,549 | 118,468 | |
Workforce Unemployed | 68 | 2,047 | 6,223 | |
Civlian Workforce | 5,424 | 46,596 | 124,691 | |
Military Workforce | 16 | 99 | 565 | |
Total Households | 5,065 | 35,760 | 90,277 | |
Family Households | 1,783 | 18,316 | 53,824 | |
Non-Family Households | 3,281 | 17,444 | 36,453 | |
Married Couple | 1,442 | 13,634 | 36,714 | |
Other Family | 342 | 4,683 | 17,110 | |
Married w/Child | 268 | 4,922 | 15,617 | |
Single Male w/Child | 29 | 678 | 2,408 | |
Single Female w/Child | 72 | 1,811 | 6,278 |
Population Change Last Two Decades - Plus Projection
2000 | % | 2010 | % | 2020 | % | 2030 | |
---|---|---|---|---|---|---|---|
Texas | 20,851,820 | +21 | 25,145,561 | +18 | 29,677,668 | +18 | 34,894,452 |
Tarrant County | 1,446,219 | +25 | 1,809,034 | +19 | 2,143,755 | +17 | 2,507,170 |
Total Working Age Population:
Total Households:
Total Working Age Population:
Total Households:
Total Working Age Population:
Total Households: