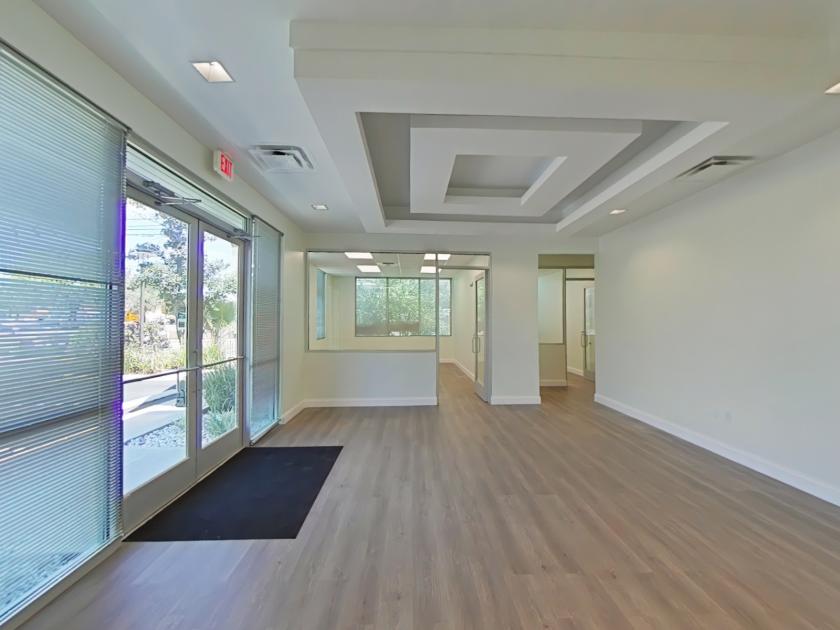
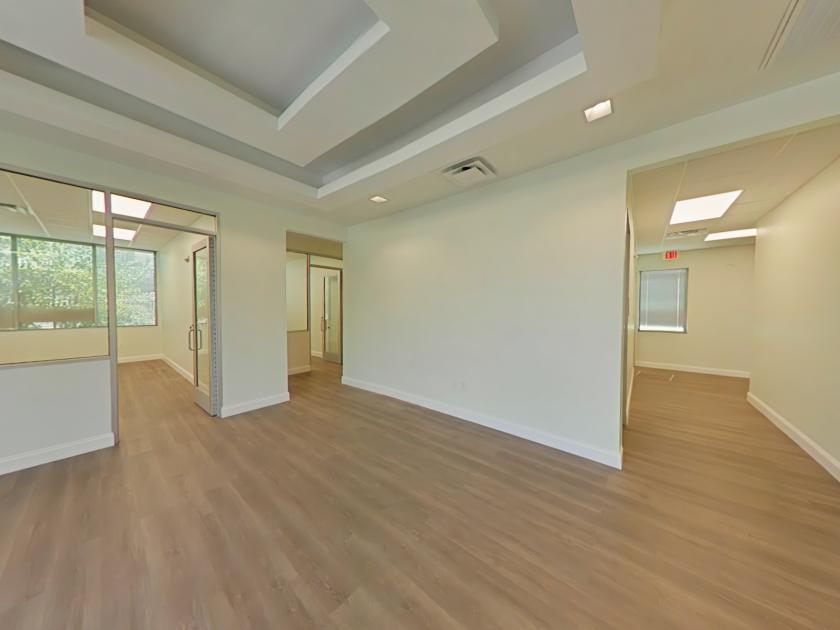
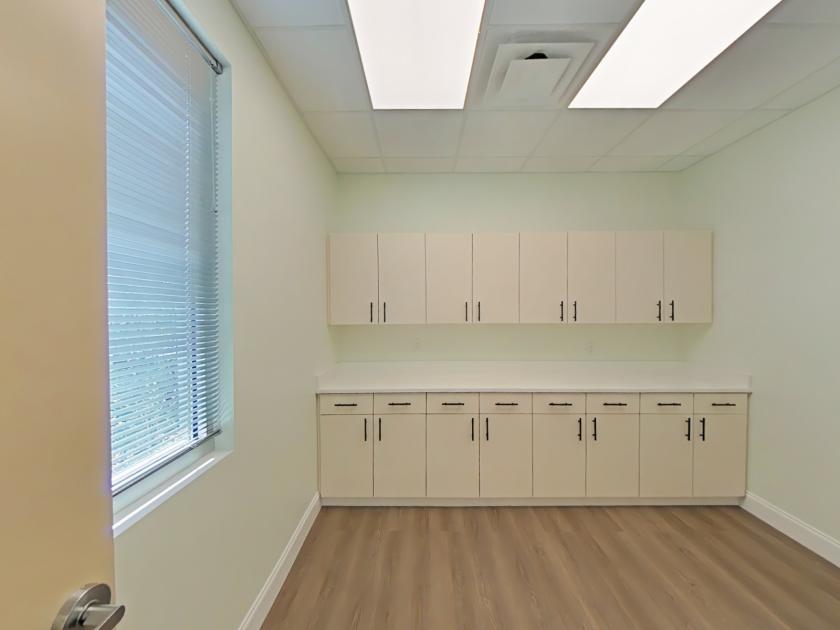
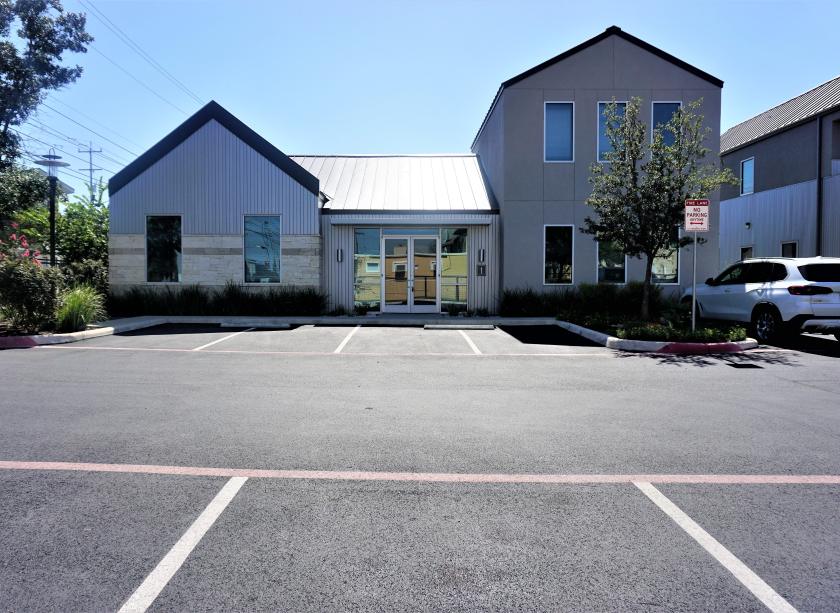
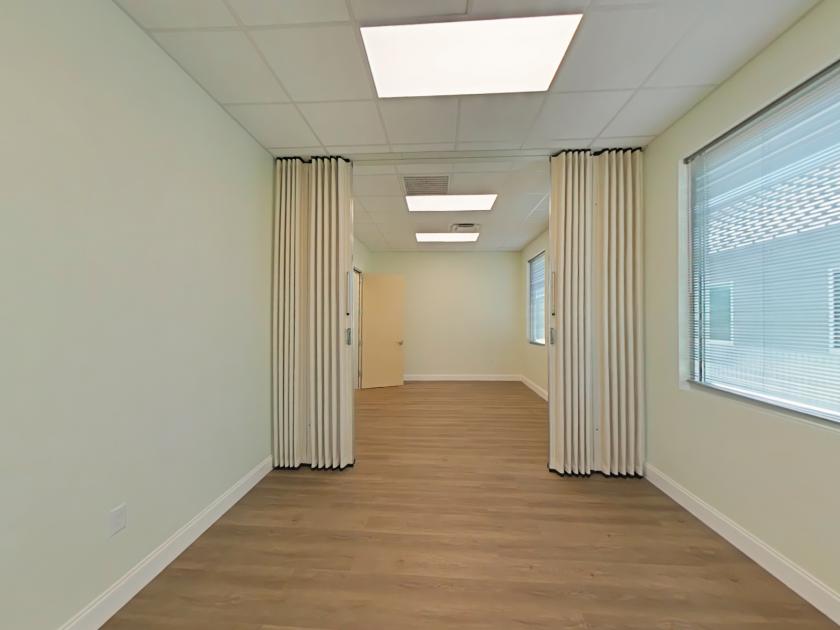
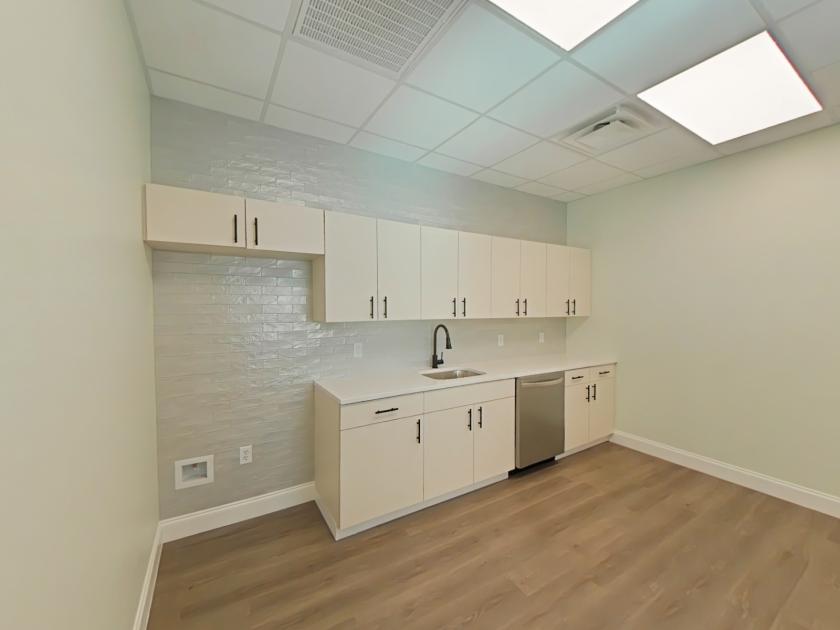
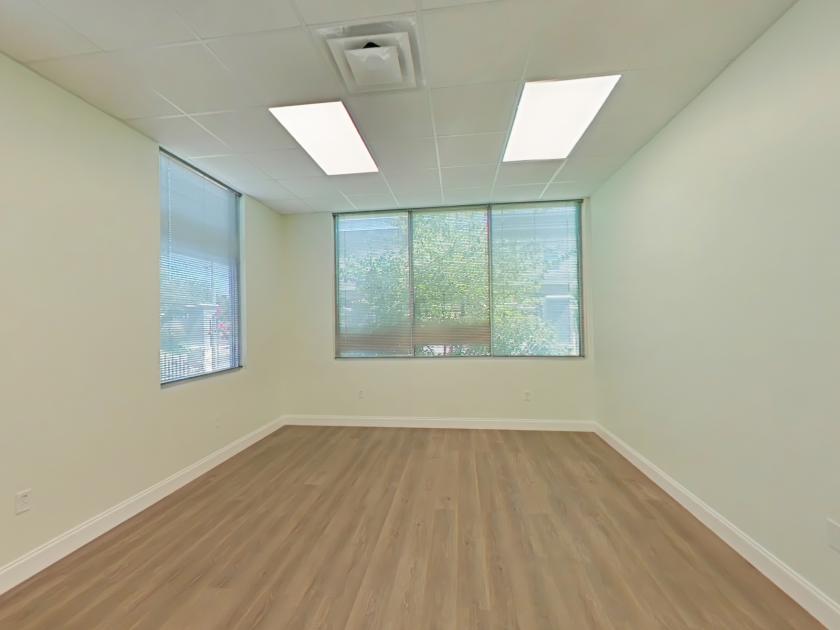
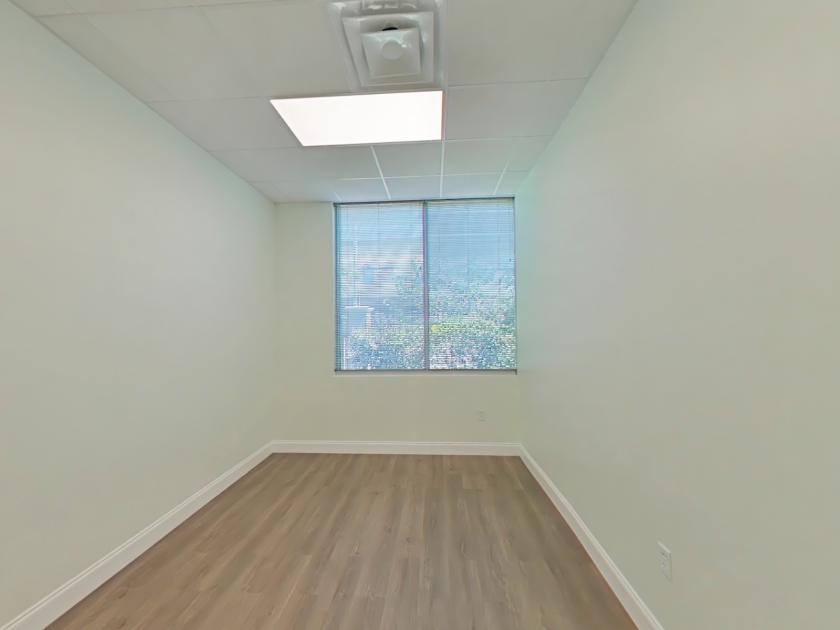
1-Mile | 3-Miles | 5-Miles | ||
---|---|---|---|---|
Total Population | 13,523 | 101,653 | 306,618 | |
Population Median Age | 40 | 38 | 38 | |
Population by Age | 0-9 Yrs | 1086 (8%) | 12755 (12%) | 36402 (11%) |
10-19 Yrs | 2000 (14%) | 13292 (13%) | 40003 (13%) | |
20-29 Yrs | 2065 (15%) | 15174 (14%) | 49275 (16%) | |
30-39 Yrs | 2112 (15%) | 13836 (13%) | 45381 (14%) | |
40-49 Yrs | 1494 (11%) | 12650 (12%) | 37441 (12%) | |
50-59 Yrs | 1547 (11%) | 13463 (13%) | 38592 (12%) | |
60-69 Yrs | 1412 (10%) | 9963 (9%) | 29296 (9%) | |
70+ Yrs | 1808 (13%) | 10521 (10%) | 30227 (9%) | |
Median HH Income | $65,104 | $57,986 | $52,086 | |
Total Household Income | < 24K | 782 (13%) | 8094 (20%) | 26326 (22%) |
25-49K | 1229 (21%) | 8651 (22%) | 29642 (25%) | |
50-74K | 1575 (27%) | 7293 (18%) | 22198 (19%) | |
75-99K | 667 (11%) | 4153 (10%) | 12651 (10%) | |
100-199K | 867 (15%) | 6417 (16%) | 17874 (15%) | |
200K+ | 535 (9%) | 4521 (11%) | 7614 (6%) | |
Highest Education Level | No Diploma | 603 | 7931 | 28373 |
Diploma or GED | 1620 | 13106 | 47427 | |
Some College | 2135 | 14553 | 47995 | |
Assoc. Degree | 509 | 4538 | 15206 | |
Bachelors Degree | 2408 | 15902 | 39034 | |
Higher Degree | 2153 | 12102 | 28435 | |
Total Housing Units | 6,373 | 44,214 | 129,267 | |
--Owner-Occupied | 2,112 | 20,084 | 54,638 | |
--Renter-Occupied | 3,543 | 19,045 | 61,667 | |
Owner-Occupied Values | < 100K | 196 | 2364 | 8955 |
100-199K | 765 | 6260 | 20813 | |
200-299K | 350 | 3206 | 10141 | |
300-399K | 259 | 2578 | 6423 | |
400-499K | 78 | 1493 | 2722 | |
500K+ | 465 | 4183 | 5584 | |
Total Working Age Population | 11,218 | 81,254 | 247,854 | |
In Work Force | 7,201 | 51,968 | 161,809 | |
Not In Work Force | 4,017 | 29,286 | 86,045 | |
Workforce Employed | 6,898 | 48,746 | 150,858 | |
Workforce Unemployed | 226 | 2,393 | 7,713 | |
Civlian Workforce | 7,124 | 51,139 | 158,571 | |
Military Workforce | 76 | 829 | 3,238 | |
Total Households | 5,655 | 39,129 | 116,305 | |
Family Households | 2,828 | 21,777 | 63,814 | |
Non-Family Households | 2,827 | 17,352 | 52,490 | |
Married Couple | 1,841 | 14,768 | 42,334 | |
Other Family | 987 | 7,009 | 21,480 | |
Married w/Child | 711 | 6,387 | 17,299 | |
Single Male w/Child | 157 | 595 | 1,946 | |
Single Female w/Child | 295 | 2,826 | 8,386 |
Population Change Last Two Decades - Plus Projection
2000 | % | 2010 | % | 2020 | % | 2030 | |
---|---|---|---|---|---|---|---|
Texas | 20,851,820 | +21 | 25,145,561 | +18 | 29,677,668 | +18 | 34,894,452 |
Bexar County | 1,392,931 | +23 | 1,714,773 | +22 | 2,093,502 | +20 | 2,502,617 |
Total Working Age Population:
Total Households:
Total Working Age Population:
Total Households:
Total Working Age Population:
Total Households: