Office Space
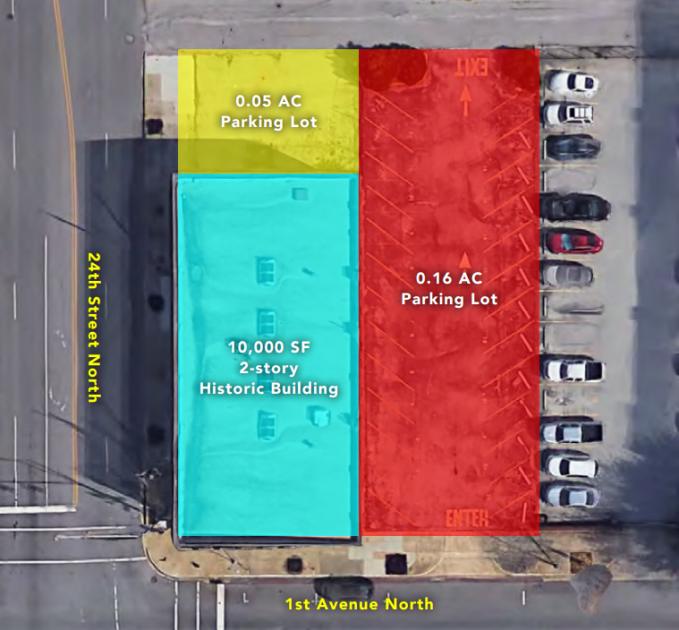
2400 1st Avenue North Birmingham, AL 35203
2400 1st Avenue North Birmingham, AL 35203
Details & Description
Property Highlights
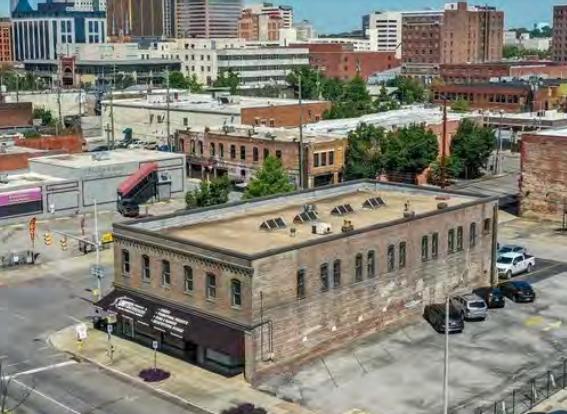
• 12.5’ ceiling heights with exceptional views of both the Downtown Birmingham city skyline and Red Mountain
• The second story features historic wood flooring throughout with modern “period” skylights overhead
Listing Agents

Casey Howard
O: 205-323-2020
M: 205-458-8130
choward@harbertrealty.com
O: 205-323-2020
M: 205-458-8130
choward@harbertrealty.com
While we strive to provide the most accurate information, all listing information, and demographic data, is provided by third-parties. As such, MyEListing will not be responsible for the accuracy of the information. It is strongly recommended that you verify all information with the listing agent, and any relevant agencies, prior to making any decisions.