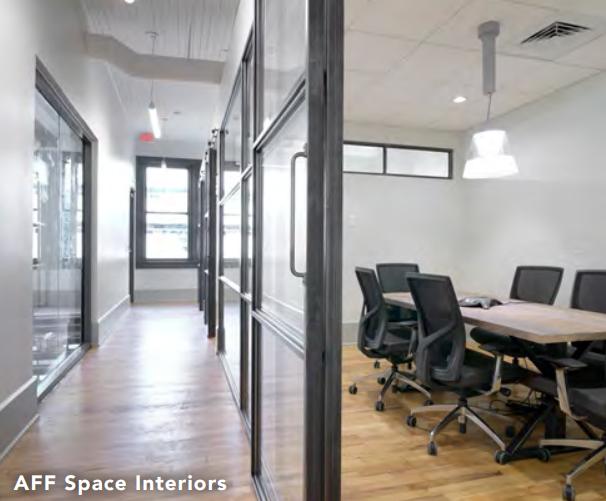
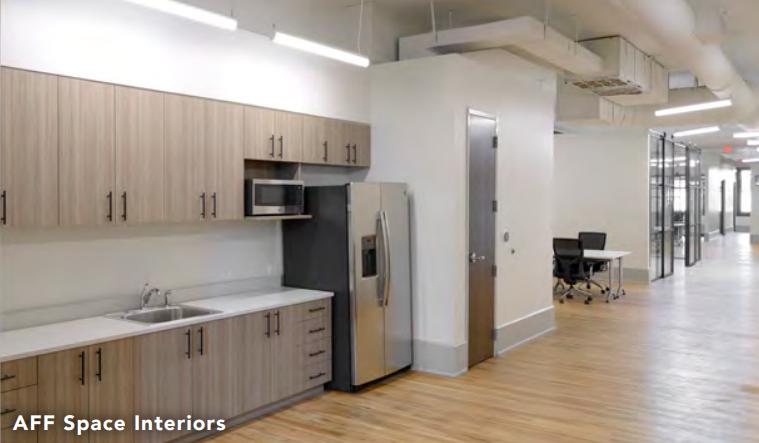
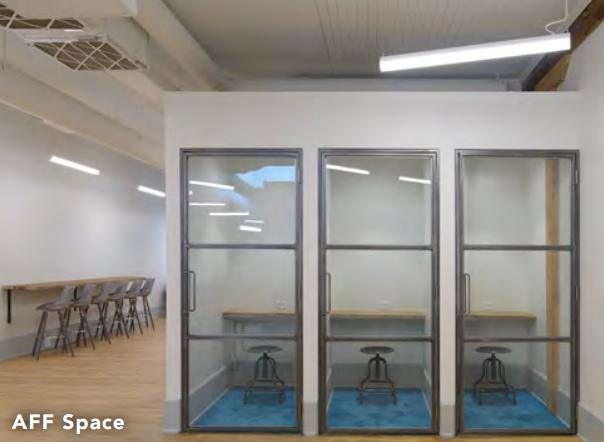
Office Space
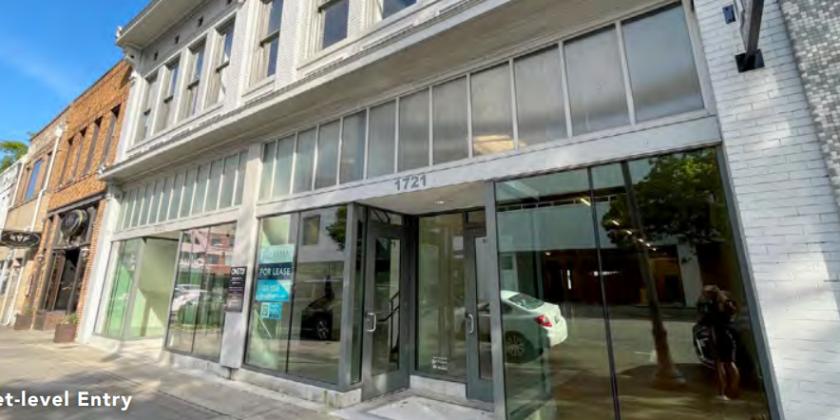
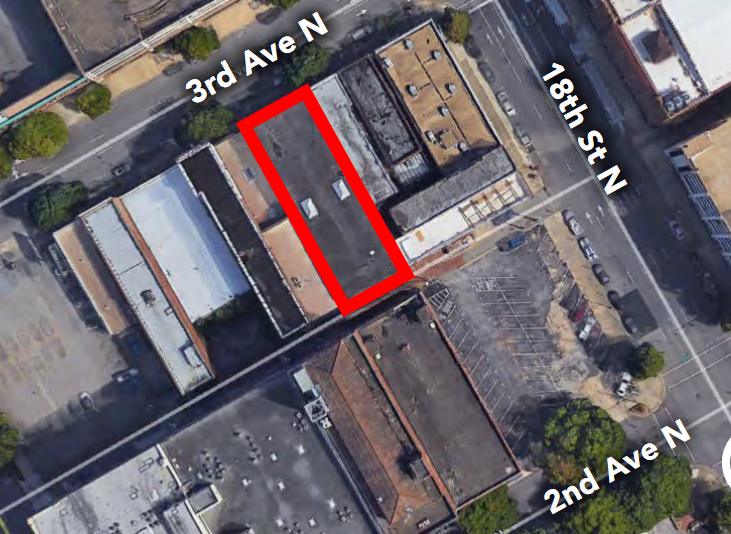
1721 3rd Avenue North Birmingham, AL 35203
1721 3rd Avenue North Birmingham, AL 35203
Details & Description
Property Highlights
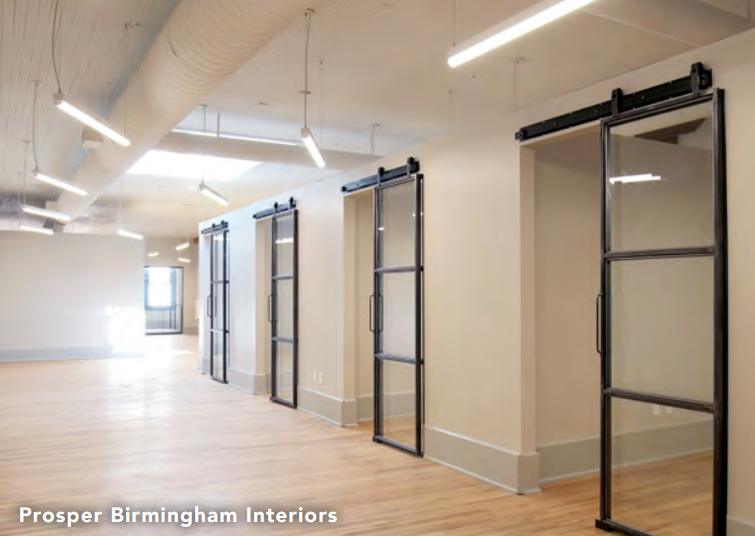
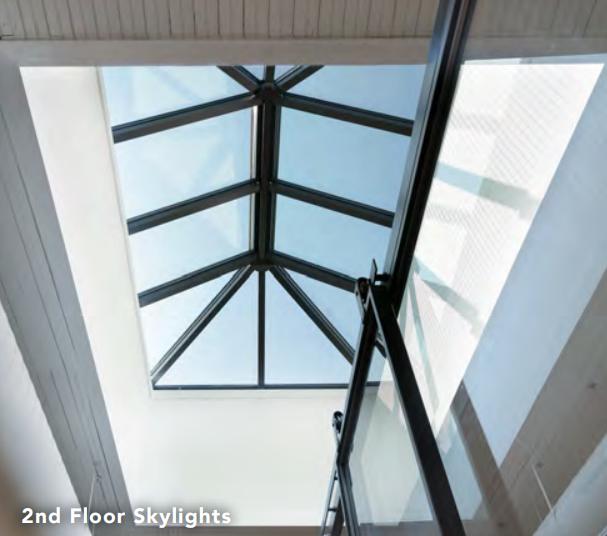
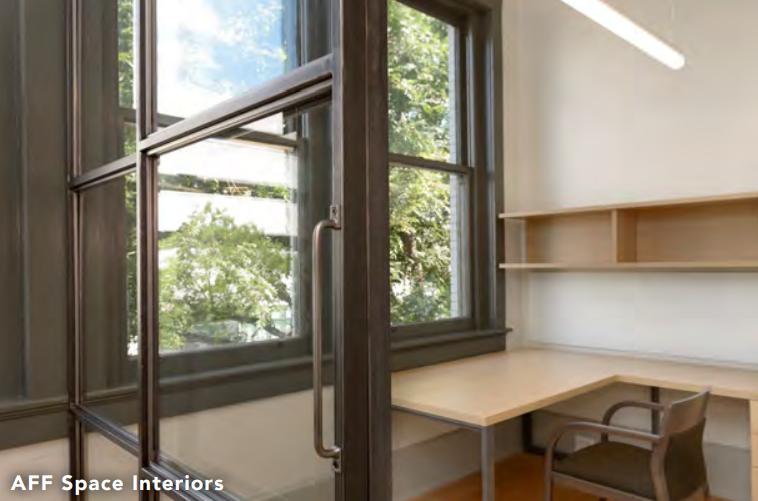
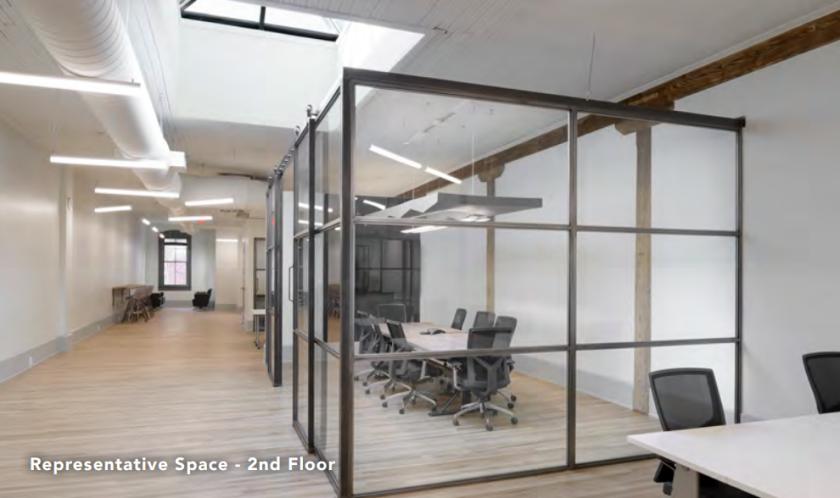
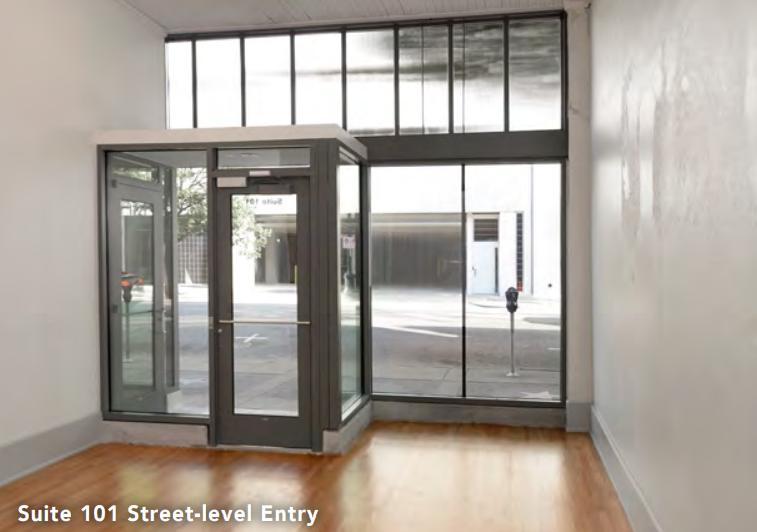
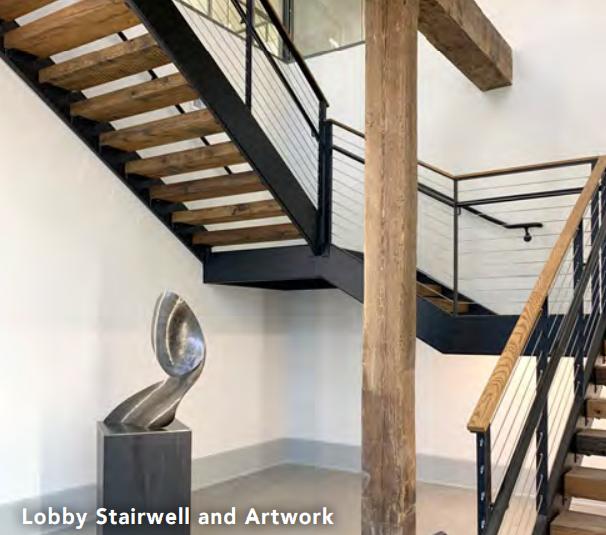
- • 14,000 SF Historic Renovation
- • Unique 2-story building on 3rd Avenue North
- • High visibility location along 3rd Ave North
Additional Photos
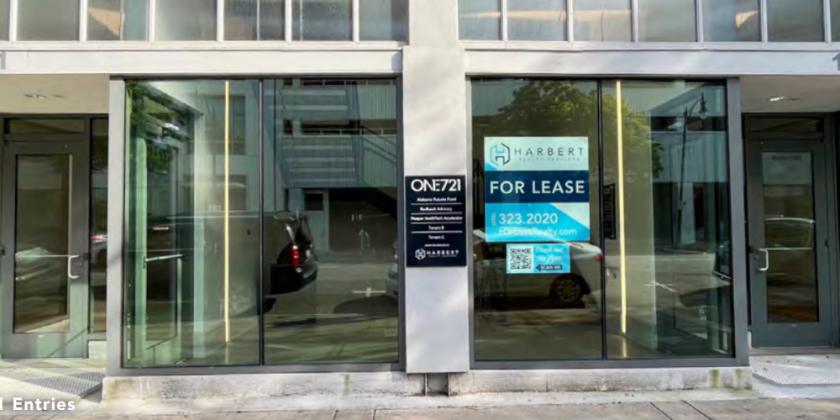
Listing Agents

Casey Howard
O: 205-323-2020
M: 205-458-8130
choward@harbertrealty.com
O: 205-323-2020
M: 205-458-8130
choward@harbertrealty.com

Charlie Norton
O: 205-458-8116
M: 205-458-8116
cnorton@harbertrealty.com
O: 205-458-8116
M: 205-458-8116
cnorton@harbertrealty.com
While we strive to provide the most accurate information, all listing information, and demographic data, is provided by third-parties. As such, MyEListing will not be responsible for the accuracy of the information. It is strongly recommended that you verify all information with the listing agent, and any relevant agencies, prior to making any decisions.