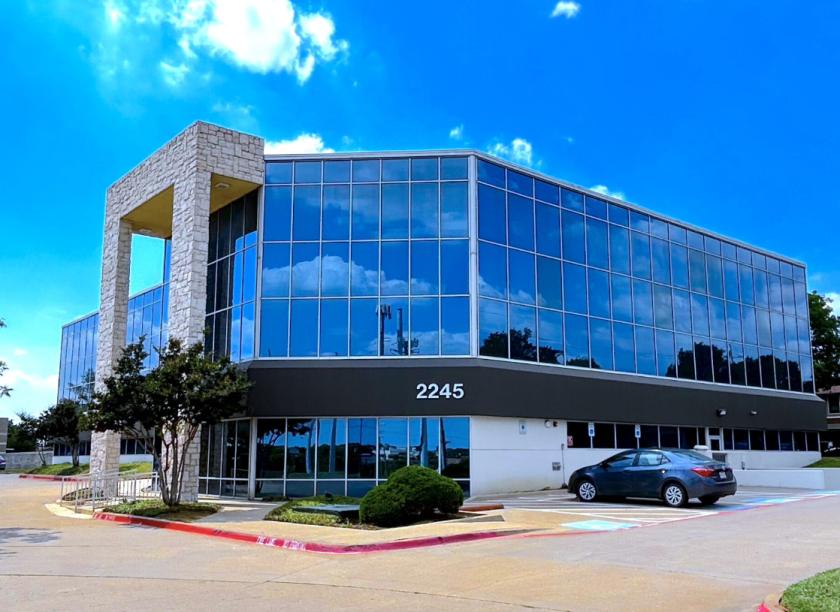
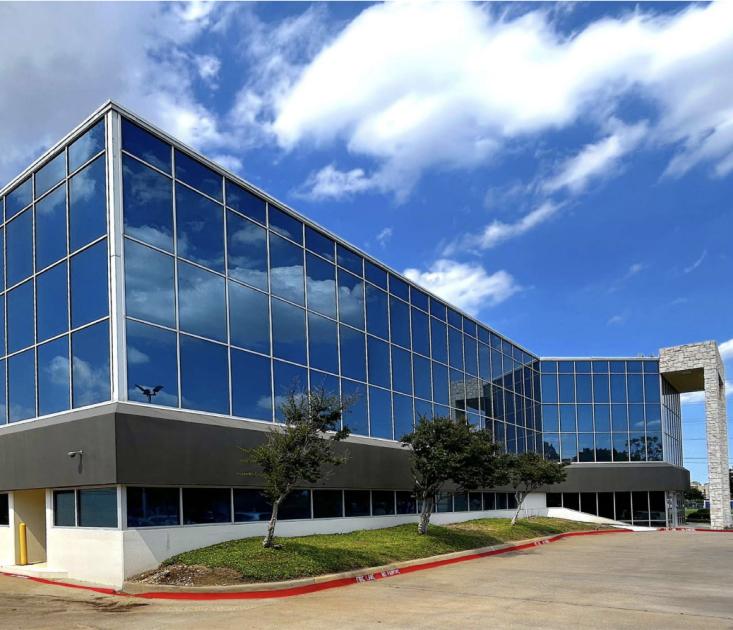
Office Space
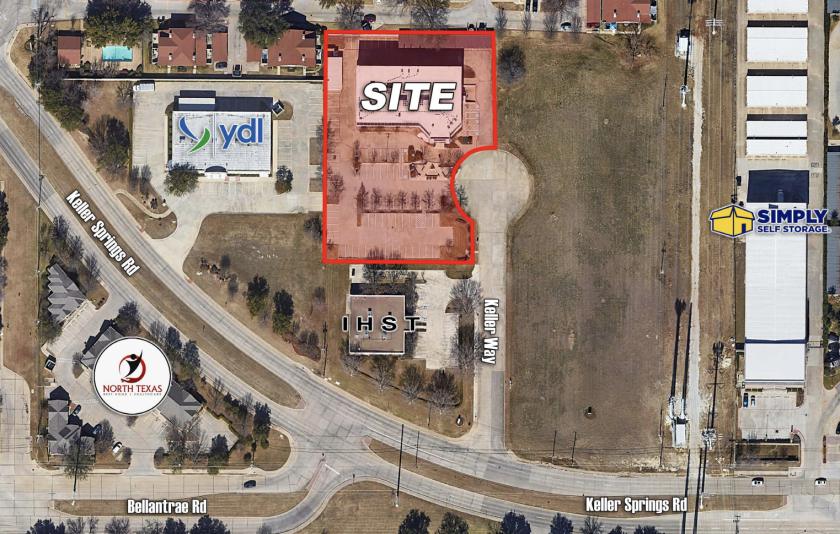
2245 Keller Way Carrollton, TX 75006
2245 Keller Way Carrollton, TX 75006
Details & Description
Property Highlights
• For a complete list of all available properties, please visit www.ridgepcre.com
• For a complete list of all available properties, please visit www.ridgepcre.com
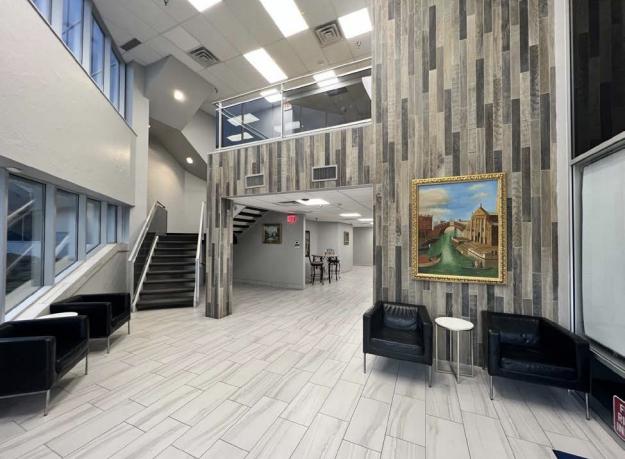
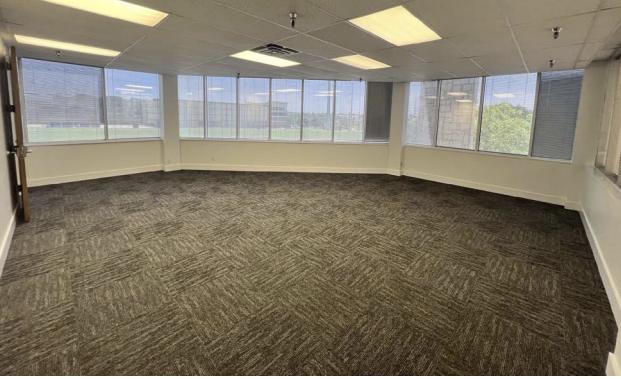
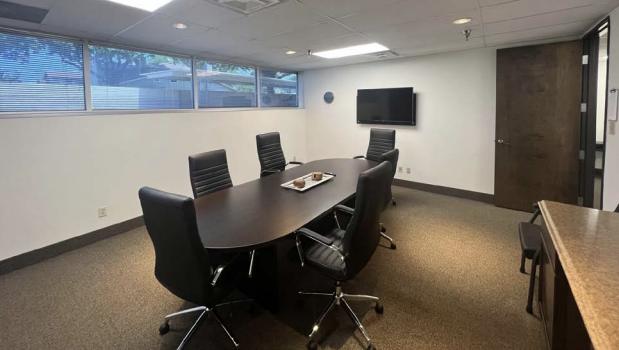
Additional Photos
Listing Agents

David English
O: 972-961-8532
M: 214-676-6424
denglish@ridgepcre.com
O: 972-961-8532
M: 214-676-6424
denglish@ridgepcre.com
While we strive to provide the most accurate information, all listing information, and demographic data, is provided by third-parties. As such, MyEListing will not be responsible for the accuracy of the information. It is strongly recommended that you verify all information with the listing agent, and any relevant agencies, prior to making any decisions.