Retail Space
8551 North Silverbell Road Tucson, AZ 85743
8551 North Silverbell Road Tucson, AZ 85743
Details & Description
Property Highlights
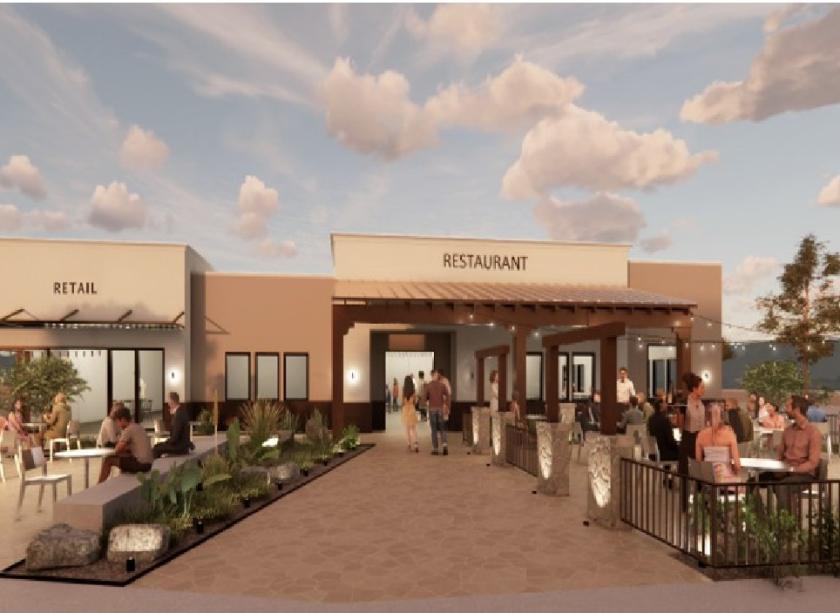
- • Land Area ± 39,280
- • Building Area ±5,300 SF
- • Retail/Restaurant spaces: 2,000 sf / 3,300 sf
- • Traffic Count 21,758 VPD (Q3 2022)
Listing Agents

Batoun Herrington
O: 520-524-5248
batoun@branelre.com
O: 520-524-5248
batoun@branelre.com
While we strive to provide the most accurate information, all listing information, and demographic data, is provided by third-parties. As such, MyEListing will not be responsible for the accuracy of the information. It is strongly recommended that you verify all information with the listing agent, and any relevant agencies, prior to making any decisions.


