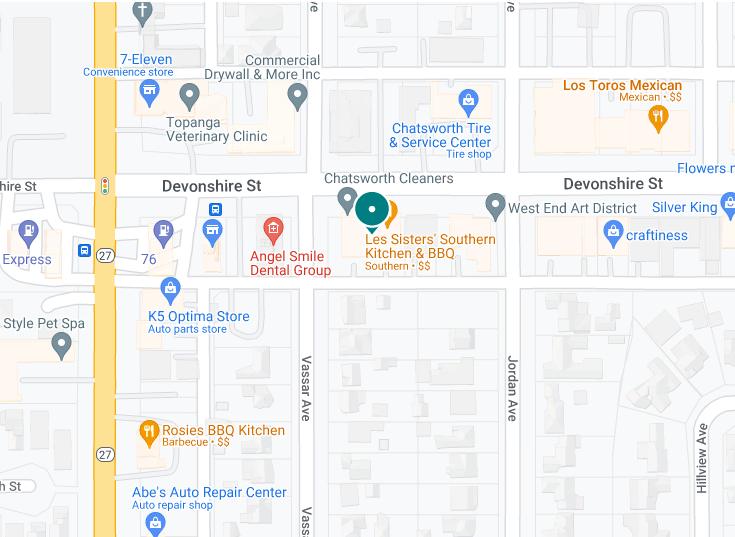
1-Mile | 3-Miles | 5-Miles | ||
---|---|---|---|---|
Total Population | 17,024 | 97,763 | 336,064 | |
Population Median Age | 41 | 40 | 39 | |
Population by Age | 0-9 Yrs | 1660 (9%) | 11679 (11%) | 37605 (11%) |
10-19 Yrs | 1885 (11%) | 11291 (11%) | 39877 (11%) | |
20-29 Yrs | 2415 (14%) | 12235 (12%) | 50548 (15%) | |
30-39 Yrs | 2505 (14%) | 12956 (13%) | 46929 (13%) | |
40-49 Yrs | 2253 (13%) | 13669 (13%) | 45807 (13%) | |
50-59 Yrs | 2395 (14%) | 13553 (13%) | 45743 (13%) | |
60-69 Yrs | 2001 (11%) | 11343 (11%) | 35462 (10%) | |
70+ Yrs | 1910 (11%) | 11037 (11%) | 34094 (10%) | |
Median HH Income | $94,494 | $86,259 | $83,235 | |
Total Household Income | < 24K | 615 (10%) | 4064 (12%) | 15879 (14%) |
25-49K | 774 (13%) | 5297 (16%) | 18330 (16%) | |
50-74K | 706 (12%) | 5137 (15%) | 16736 (15%) | |
75-99K | 939 (16%) | 4194 (12%) | 13982 (12%) | |
100-199K | 1854 (32%) | 9564 (29%) | 32409 (29%) | |
200K+ | 766 (13%) | 4519 (13%) | 13768 (12%) | |
Highest Education Level | No Diploma | 1003 | 8223 | 33987 |
Diploma or GED | 2712 | 13644 | 45587 | |
Some College | 2909 | 14066 | 47370 | |
Assoc. Degree | 1152 | 6536 | 20194 | |
Bachelors Degree | 3025 | 17034 | 57304 | |
Higher Degree | 1486 | 9402 | 29206 | |
Total Housing Units | 5,838 | 34,372 | 116,422 | |
--Owner-Occupied | 3,064 | 18,722 | 59,779 | |
--Renter-Occupied | 2,590 | 14,053 | 51,325 | |
Owner-Occupied Values | < 100K | 100 | 979 | 1870 |
100-199K | 32 | 322 | 630 | |
200-299K | 97 | 327 | 1230 | |
300-399K | 394 | 1049 | 3541 | |
400-499K | 415 | 1877 | 7458 | |
500K+ | 2025 | 14167 | 45051 | |
Total Working Age Population | 14,328 | 79,724 | 275,903 | |
In Work Force | 9,969 | 53,549 | 184,951 | |
Not In Work Force | 4,359 | 26,175 | 90,952 | |
Workforce Employed | 9,393 | 50,801 | 173,816 | |
Workforce Unemployed | 557 | 2,716 | 10,978 | |
Civlian Workforce | 9,950 | 53,517 | 184,794 | |
Military Workforce | 19 | 32 | 157 | |
Total Households | 5,654 | 32,774 | 111,104 | |
Family Households | 4,076 | 23,504 | 78,481 | |
Non-Family Households | 1,578 | 9,270 | 32,623 | |
Married Couple | 2,756 | 17,571 | 56,806 | |
Other Family | 1,320 | 5,934 | 21,675 | |
Married w/Child | 1,110 | 7,132 | 23,201 | |
Single Male w/Child | 186 | 757 | 2,482 | |
Single Female w/Child | 307 | 1,501 | 6,235 |
Population Change Last Two Decades - Plus Projection
2000 | % | 2010 | % | 2020 | % | 2030 | |
---|---|---|---|---|---|---|---|
California | 33,871,648 | +10 | 37,253,956 | +9 | 40,467,295 | +8 | 43,631,295 |
Ventura County | 753,197 | +9 | 823,318 | +5 | 863,528 | +5 | 909,779 |
Los Angeles County | 9,519,338 | +3 | 9,818,605 | +6 | 10,369,367 | +4 | 10,759,850 |
Total Working Age Population:
Total Households:
Total Working Age Population:
Total Households:
Total Working Age Population:
Total Households: