Office Space
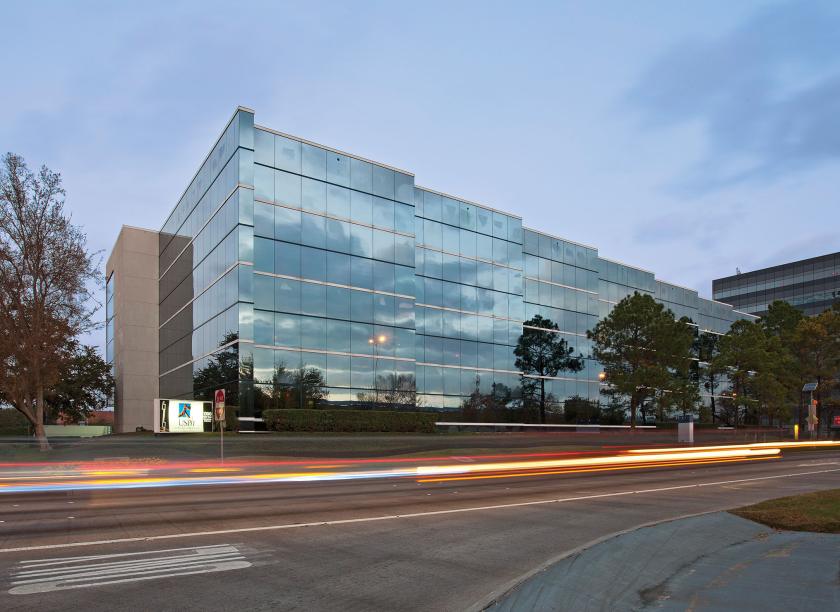
1300 West Sam Houston Parkway South Houston, TX 77042
1300 West Sam Houston Parkway South Houston, TX 77042
Details & Description
Property Highlights
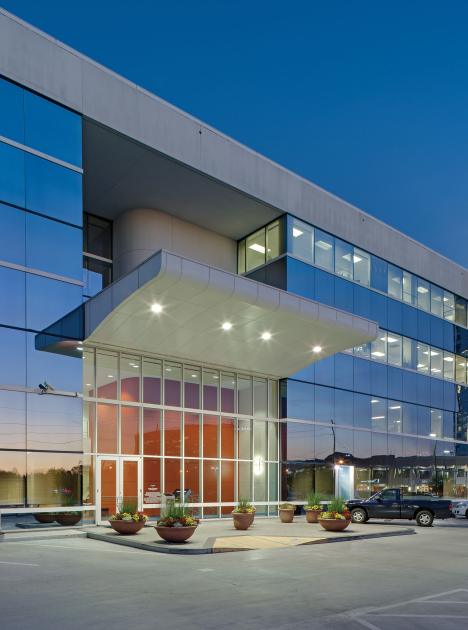
- • 4-story building
- • Free unreserved parking with 3.00/1,000 SF ratio
- • Card key access
- • On-site security
- • Nearby retail and food options
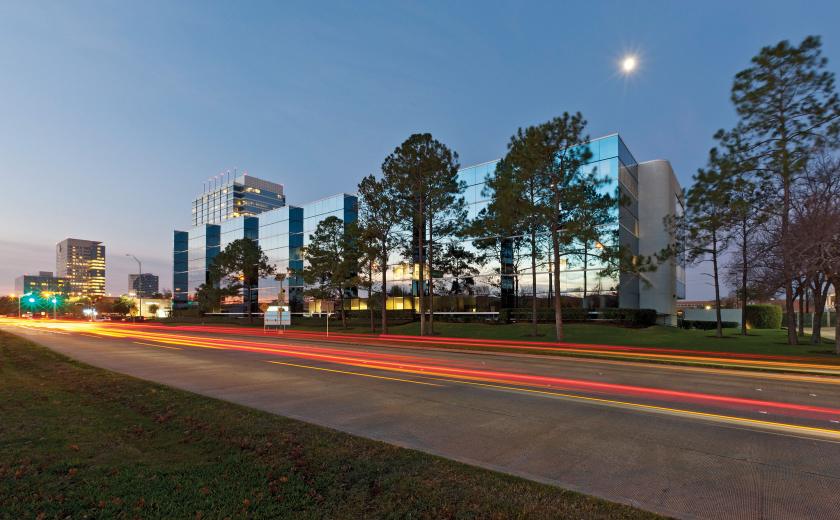
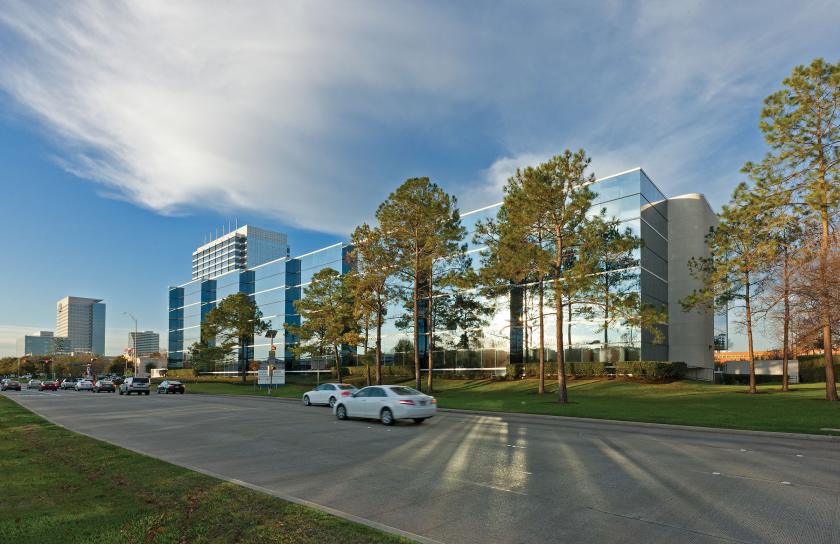
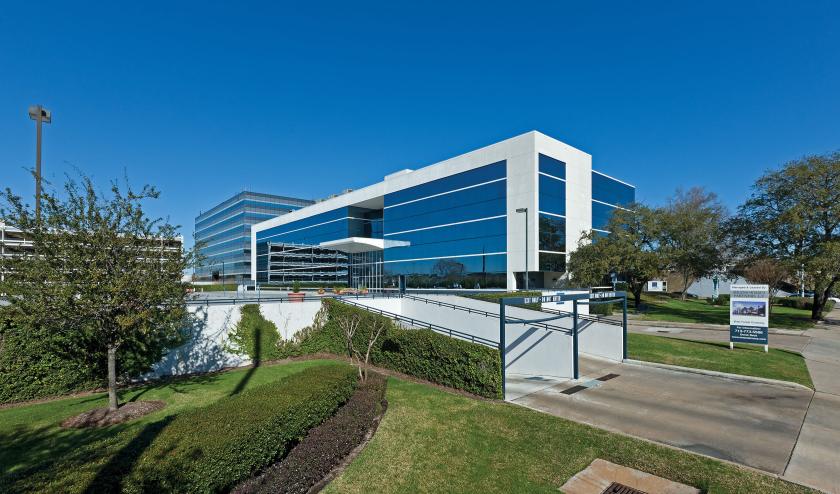
Additional Photos
Listing Agents

Douglas Pack
O: 713-835-0041
M: 713-818-5782
doug.pack@colliers.com
O: 713-835-0041
M: 713-818-5782
doug.pack@colliers.com

Sam Hansen
O: 713-835-0040
M: 281-684-1766
sam.hansen@colliers.com
O: 713-835-0040
M: 281-684-1766
sam.hansen@colliers.com
While we strive to provide the most accurate information, all listing information, and demographic data, is provided by third-parties. As such, MyEListing will not be responsible for the accuracy of the information. It is strongly recommended that you verify all information with the listing agent, and any relevant agencies, prior to making any decisions.


