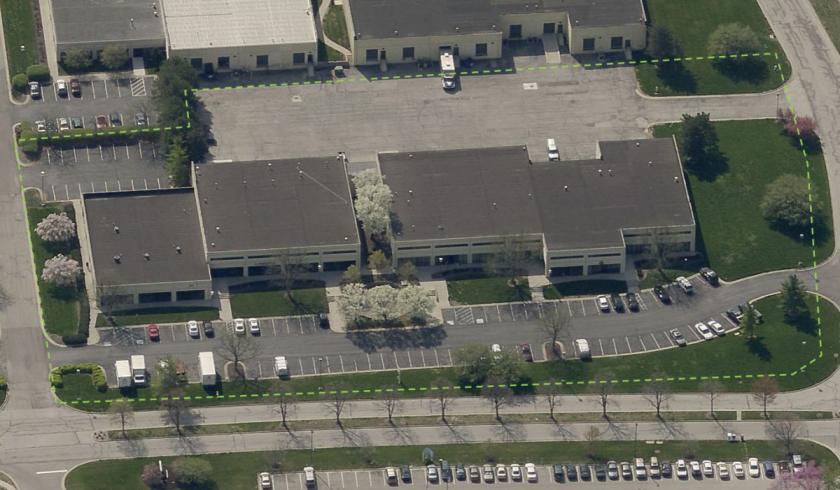
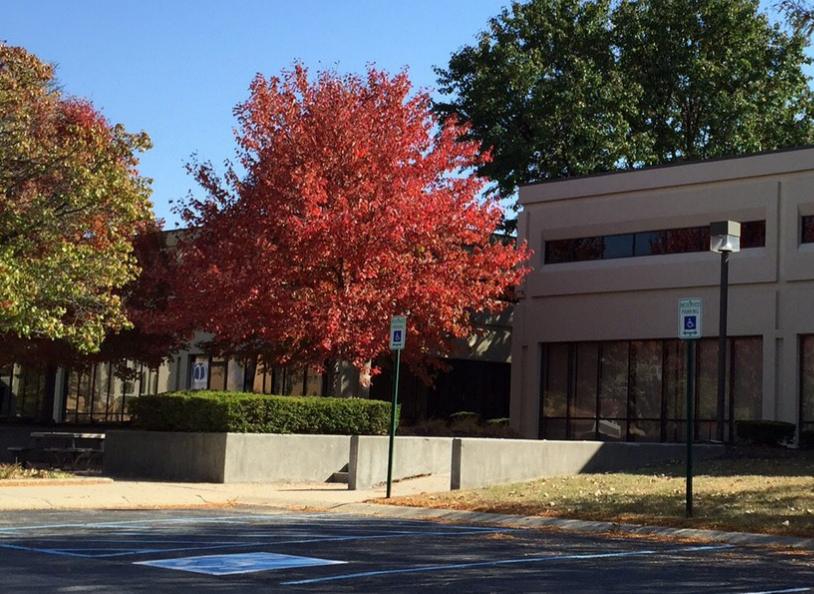
1-Mile | 3-Miles | 5-Miles | ||
---|---|---|---|---|
Total Population | 4,901 | 52,071 | 139,268 | |
Population Median Age | 38 | 37 | 37 | |
Population by Age | 0-9 Yrs | 586 (11%) | 7212 (13%) | 19058 (13%) |
10-19 Yrs | 448 (9%) | 6687 (12%) | 19056 (13%) | |
20-29 Yrs | 1007 (20%) | 8225 (15%) | 18732 (13%) | |
30-39 Yrs | 934 (19%) | 7704 (14%) | 19075 (13%) | |
40-49 Yrs | 447 (9%) | 6430 (12%) | 17746 (12%) | |
50-59 Yrs | 498 (10%) | 5470 (10%) | 17720 (12%) | |
60-69 Yrs | 399 (8%) | 4876 (9%) | 14500 (10%) | |
70+ Yrs | 581 (11%) | 5465 (10%) | 13379 (9%) | |
Median HH Income | $48,376 | $57,372 | $69,752 | |
Total Household Income | < 24K | 457 (18%) | 4590 (21%) | 8731 (15%) |
25-49K | 894 (35%) | 5370 (24%) | 11853 (21%) | |
50-74K | 436 (17%) | 3368 (15%) | 8856 (16%) | |
75-99K | 340 (13%) | 2976 (13%) | 6604 (12%) | |
100-199K | 353 (14%) | 3711 (17%) | 11675 (21%) | |
200K+ | 19 (0%) | 1731 (7%) | 7274 (13%) | |
Highest Education Level | No Diploma | 180 | 2652 | 5903 |
Diploma or GED | 607 | 6015 | 15467 | |
Some College | 723 | 6826 | 16728 | |
Assoc. Degree | 250 | 2605 | 6262 | |
Bachelors Degree | 1031 | 10079 | 28084 | |
Higher Degree | 584 | 6414 | 20288 | |
Total Housing Units | 2,734 | 23,855 | 59,640 | |
--Owner-Occupied | 1,132 | 9,953 | 33,400 | |
--Renter-Occupied | 1,368 | 11,794 | 21,591 | |
Owner-Occupied Values | < 100K | 228 | 1072 | 3216 |
100-199K | 641 | 4523 | 11965 | |
200-299K | 215 | 1646 | 5763 | |
300-399K | 16 | 871 | 3359 | |
400-499K | 9 | 708 | 2998 | |
500K+ | 23 | 1132 | 6098 | |
Total Working Age Population | 4,026 | 40,820 | 108,389 | |
In Work Force | 2,970 | 28,342 | 74,675 | |
Not In Work Force | 1,055 | 12,478 | 33,713 | |
Workforce Employed | 2,906 | 27,218 | 71,873 | |
Workforce Unemployed | 64 | 1,070 | 2,730 | |
Civlian Workforce | 2,970 | 28,288 | 74,603 | |
Military Workforce | 0 | 54 | 72 | |
Total Households | 2,499 | 21,747 | 54,991 | |
Family Households | 903 | 11,155 | 32,664 | |
Non-Family Households | 1,597 | 10,592 | 22,327 | |
Married Couple | 625 | 7,569 | 24,248 | |
Other Family | 278 | 3,586 | 8,417 | |
Married w/Child | 239 | 3,173 | 10,354 | |
Single Male w/Child | 41 | 508 | 1,224 | |
Single Female w/Child | 152 | 1,854 | 3,825 |
Population Change Last Two Decades - Plus Projection
2000 | % | 2010 | % | 2020 | % | 2030 | |
---|---|---|---|---|---|---|---|
Indiana | 6,080,485 | +7 | 6,483,802 | +4 | 6,738,573 | +4 | 7,014,880 |
Hamilton County | 182,740 | +50 | 274,569 | +25 | 343,179 | +22 | 417,754 |
Boone County | 46,107 | +23 | 56,640 | +25 | 70,556 | +19 | 83,749 |
Marion County | 860,454 | +5 | 903,393 | +7 | 963,732 | +4 | 1,001,231 |
Total Working Age Population:
Total Households:
Total Working Age Population:
Total Households:
Total Working Age Population:
Total Households: