Flex-Office-Warehouse
3202 Elwood Avenue South Bend, IN 46628
3202 Elwood Avenue South Bend, IN 46628
Details & Description
Property Highlights
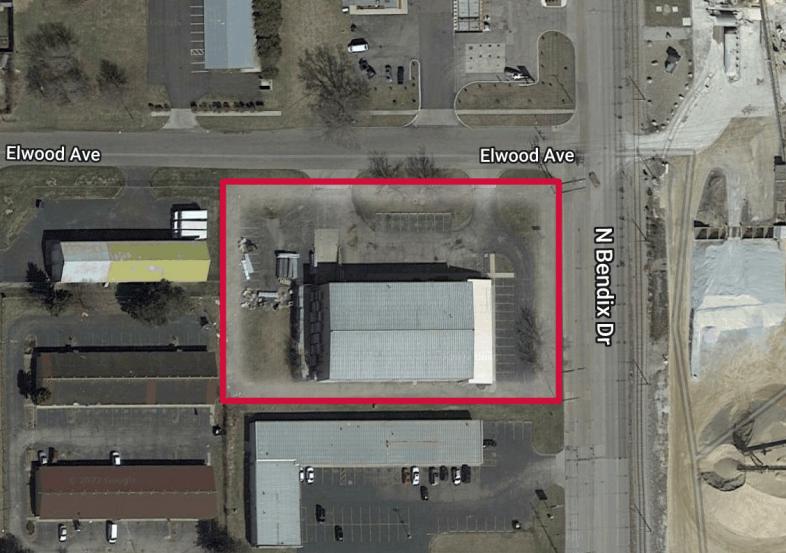
• The rear of the property has an area for outdoor storage or an expansion of the building
• Corner of Bendix Road and Elwood Avenue with multiple ingress/egress points.
Listing Agents

Blair Wozny
O: 574-485-1517
bwozny@cressy.com
O: 574-485-1517
bwozny@cressy.com

Christian Davey
O: 574-271-4060
M: 574-485-1534
cjdavey@cressy.com
O: 574-271-4060
M: 574-485-1534
cjdavey@cressy.com

Noah Davey
O: 574-271-4060
M: 574-485-1530
ndavey@cressy.com
O: 574-271-4060
M: 574-485-1530
ndavey@cressy.com
While we strive to provide the most accurate information, all listing information, and demographic data, is provided by third-parties. As such, MyEListing will not be responsible for the accuracy of the information. It is strongly recommended that you verify all information with the listing agent, and any relevant agencies, prior to making any decisions.