Industrial Properties
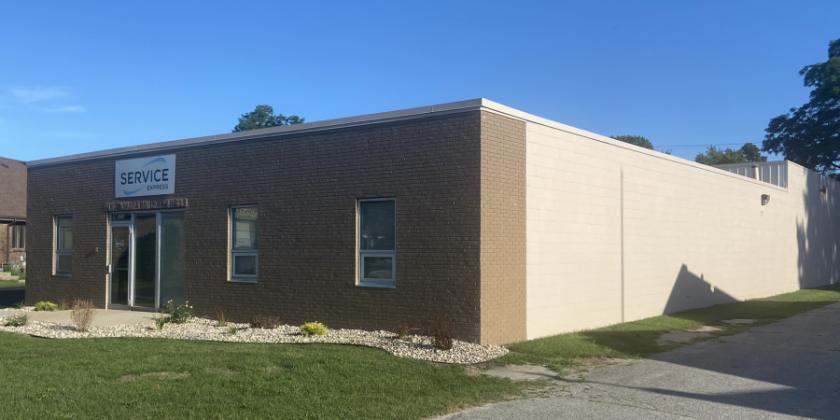
2026 Ironwood Circle South Bend, IN 46635
2026 Ironwood Circle South Bend, IN 46635

Details & Description
Property Highlights
• Minutes from the University of Notre Dame, Saint Mary’s College, Holy Cross College and Indiana University-South
• 12'-14’ Ceiling Height / Building has 2 Overhead Doors.
Listing Agents

Timothy Mehall
O: 574-271-4060
M: 574-485-1516
tmehall@cressy.com
O: 574-271-4060
M: 574-485-1516
tmehall@cressy.com
While we strive to provide the most accurate information, all listing information, and demographic data, is provided by third-parties. As such, MyEListing will not be responsible for the accuracy of the information. It is strongly recommended that you verify all information with the listing agent, and any relevant agencies, prior to making any decisions.