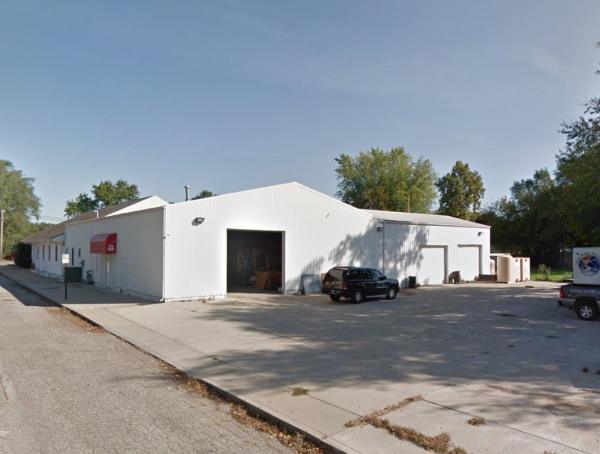
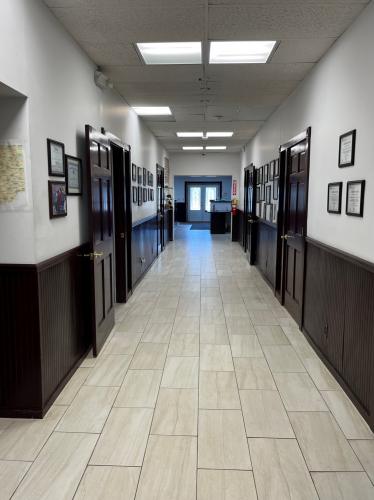
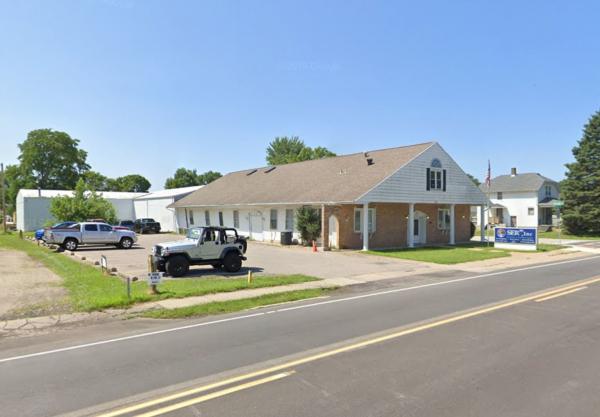
Office Space
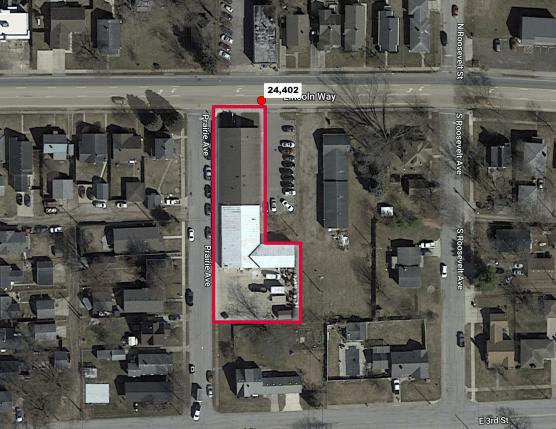
2101 Lincolnway East Mishawaka, IN 46544
2101 Lincolnway East Mishawaka, IN 46544

Details & Description
Property Highlights
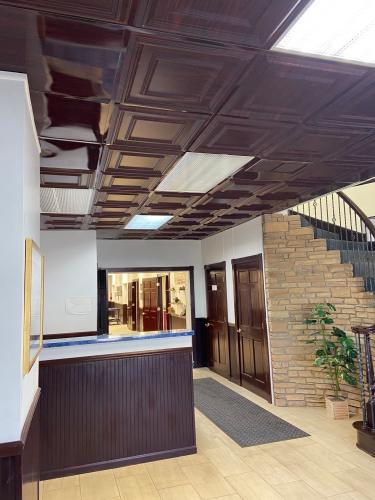
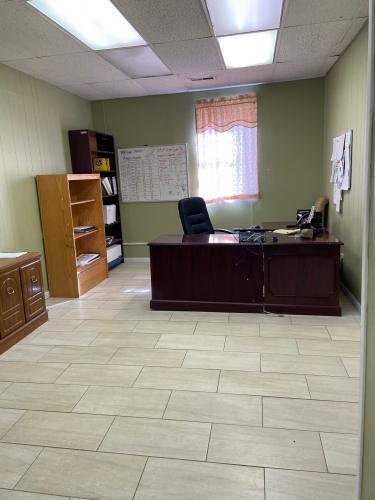
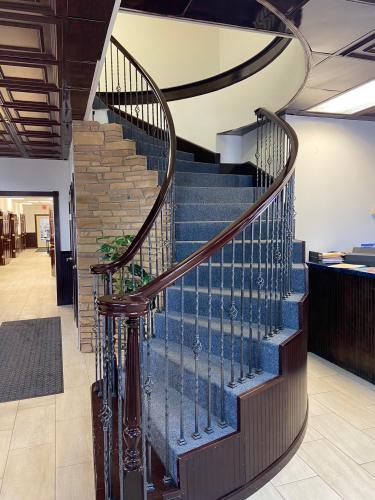
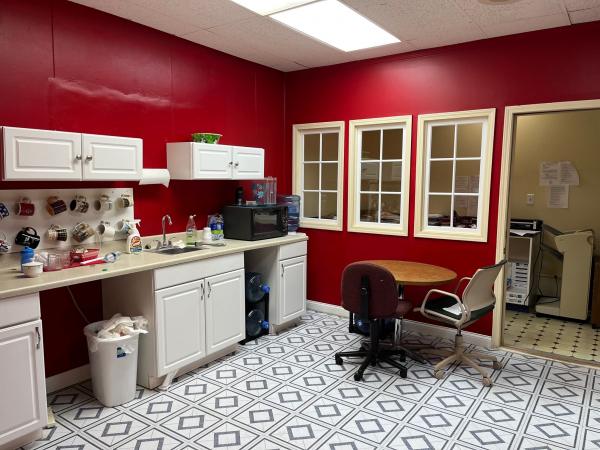
• Nicely finished office space on the 1st floor with 2,375 SF of mezzanine office accessed by spiral lobby staircase
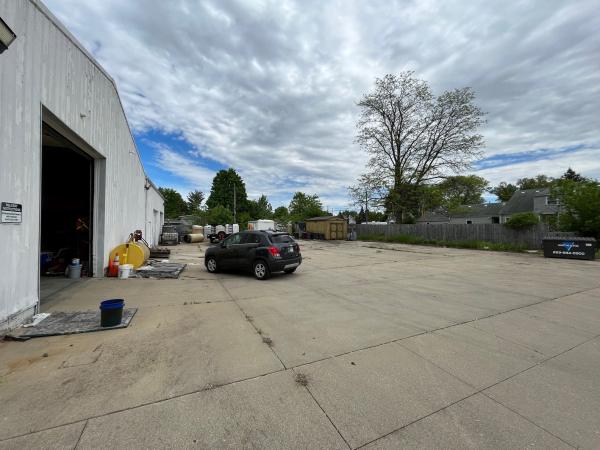
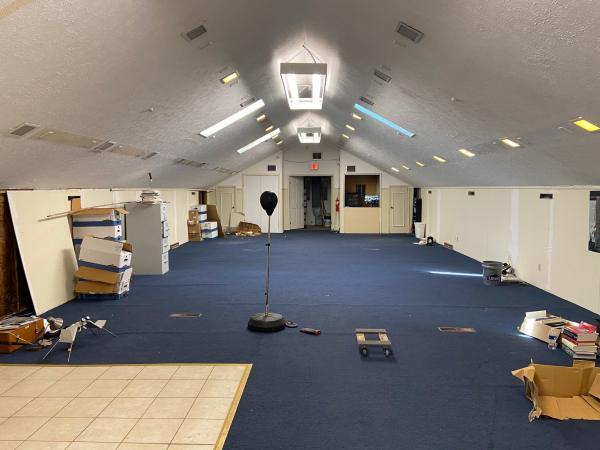
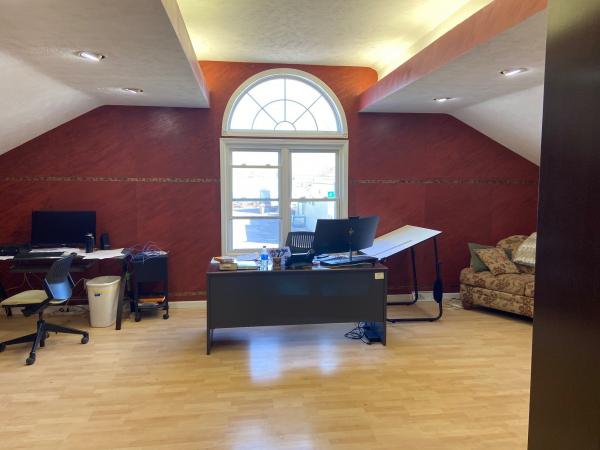
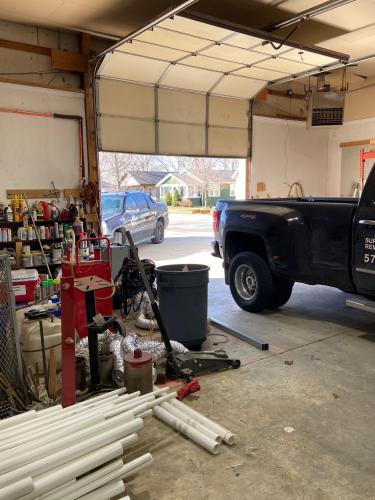
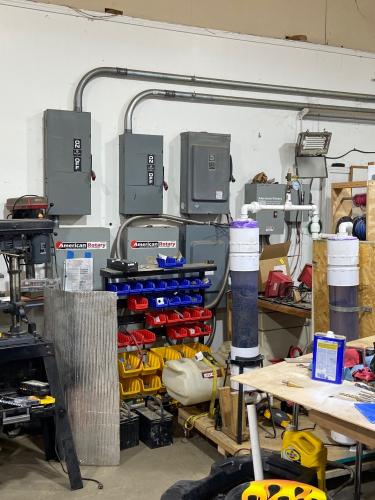
• Features private offices, reception and waiting, work room and break room and leads out to a warehouse space
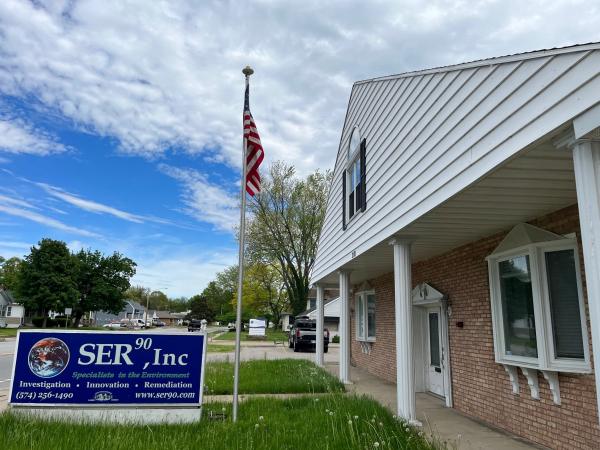
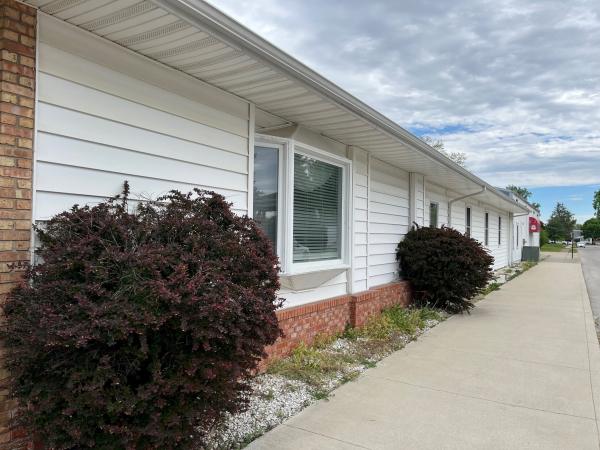
Additional Photos

Listing Agents

Shawn Todd
O: 574-271-4060
M: 574-485-1520
stodd@cressy.com
O: 574-271-4060
M: 574-485-1520
stodd@cressy.com

Ryan Gableman
O: 574-485-1502
M: 574-485-1502
rgableman@cressy.com
O: 574-485-1502
M: 574-485-1502
rgableman@cressy.com
While we strive to provide the most accurate information, all listing information, and demographic data, is provided by third-parties. As such, MyEListing will not be responsible for the accuracy of the information. It is strongly recommended that you verify all information with the listing agent, and any relevant agencies, prior to making any decisions.