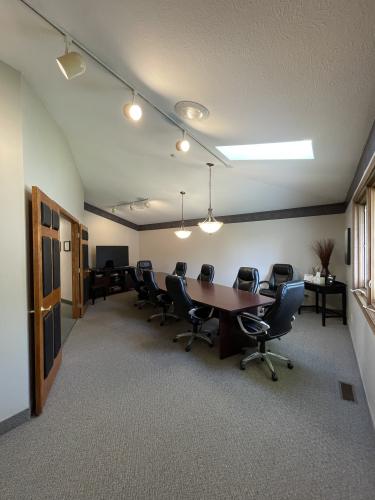
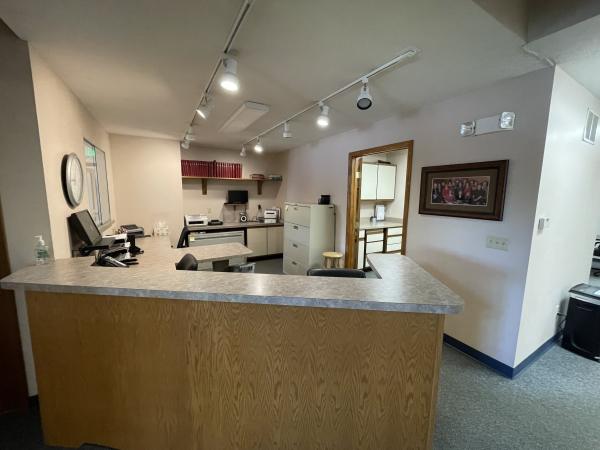
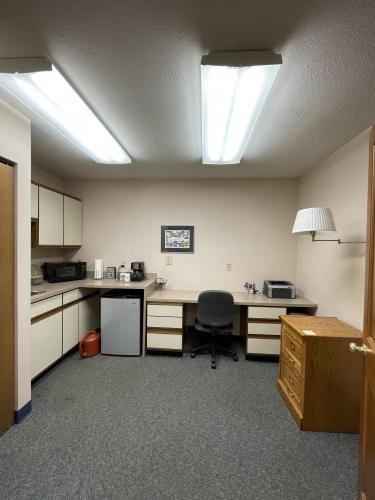
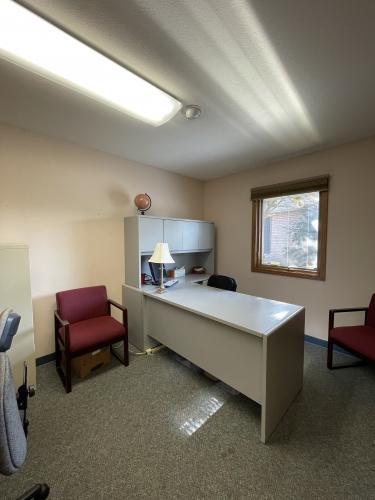
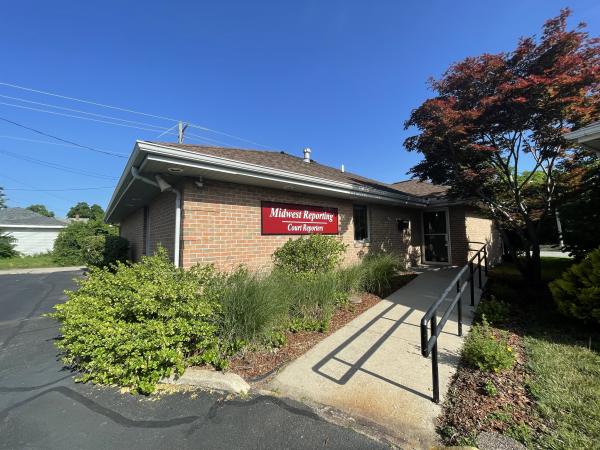
Office Space
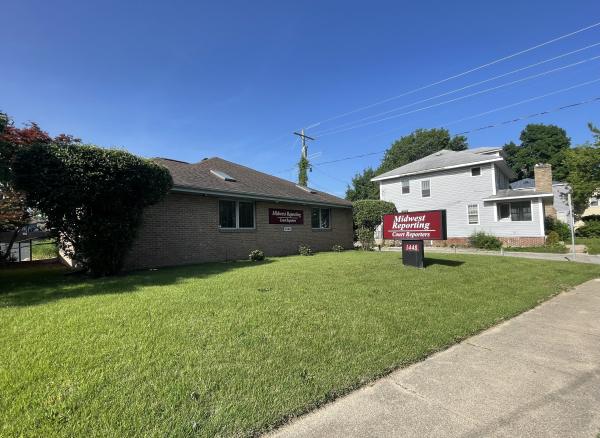
1448 Lincolnway East South Bend, IN 46613
1448 Lincolnway East South Bend, IN 46613
Details & Description
Property Highlights
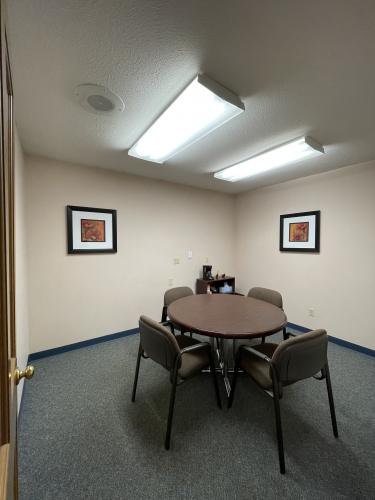
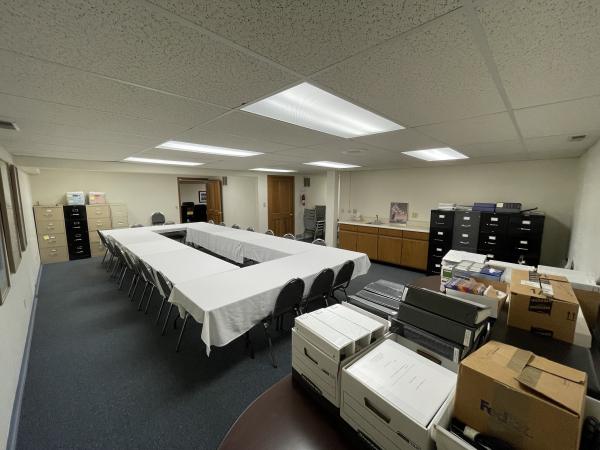
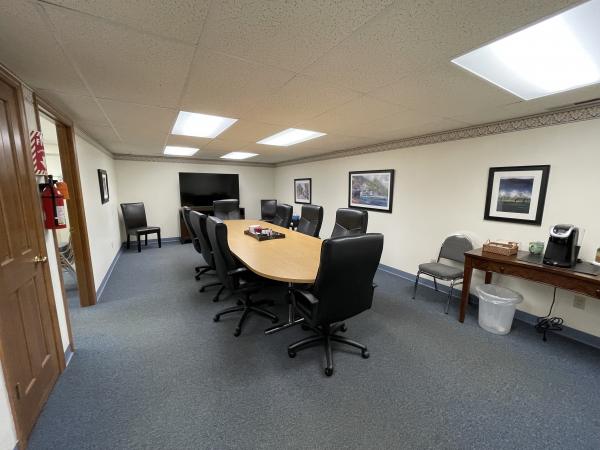
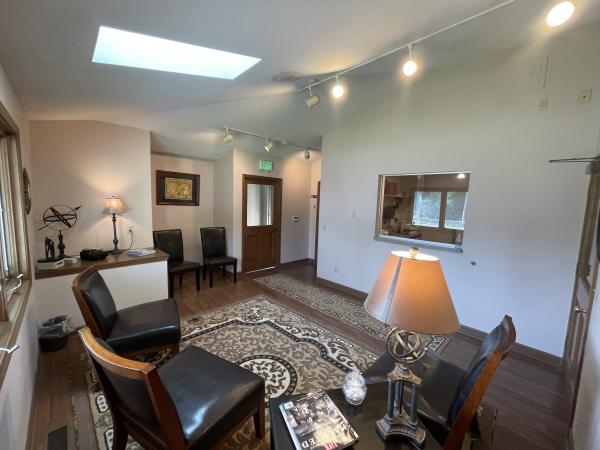
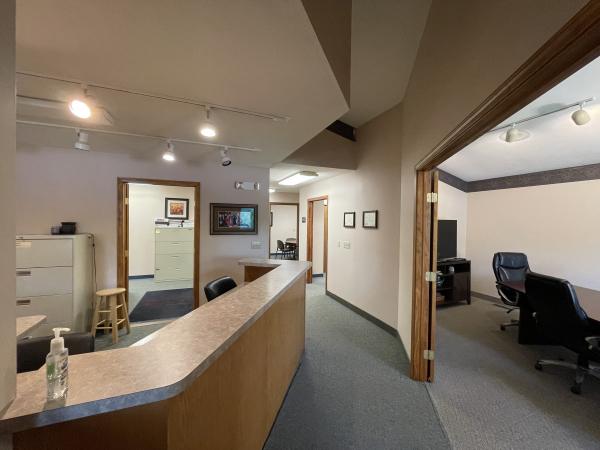
- • Turnkey Professional Office
- • Multiple Private Offices
- • One building with two shared parking lots.
Additional Photos

Listing Agents

Noah Davey
O: 574-271-4060
M: 574-485-1530
ndavey@cressy.com
O: 574-271-4060
M: 574-485-1530
ndavey@cressy.com

Christian Davey
O: 574-271-4060
M: 574-485-1534
cjdavey@cressy.com
O: 574-271-4060
M: 574-485-1534
cjdavey@cressy.com

Blair Wozny
O: 574-485-1517
bwozny@cressy.com
O: 574-485-1517
bwozny@cressy.com
While we strive to provide the most accurate information, all listing information, and demographic data, is provided by third-parties. As such, MyEListing will not be responsible for the accuracy of the information. It is strongly recommended that you verify all information with the listing agent, and any relevant agencies, prior to making any decisions.