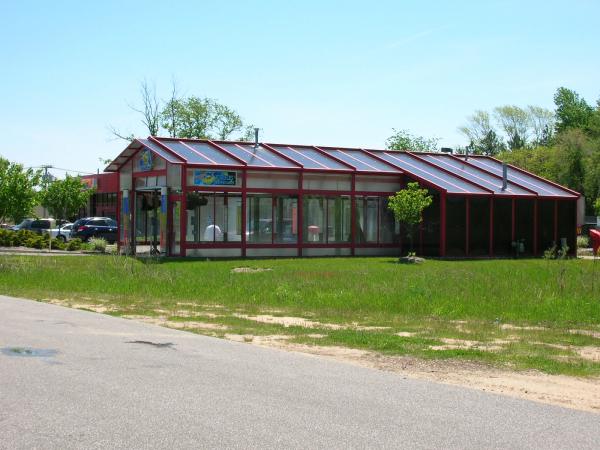
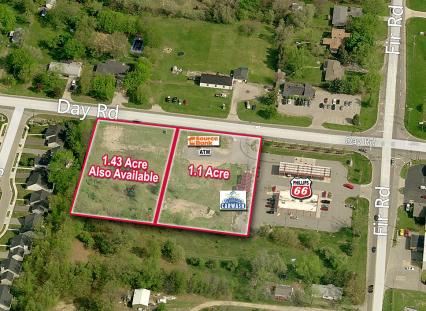
1-Mile | 3-Miles | 5-Miles | ||
---|---|---|---|---|
Total Population | 3,320 | 48,049 | 144,648 | |
Population Median Age | 37 | 39 | 37 | |
Population by Age | 0-9 Yrs | 491 (14%) | 6127 (12%) | 17268 (11%) |
10-19 Yrs | 384 (11%) | 5501 (11%) | 21791 (15%) | |
20-29 Yrs | 595 (17%) | 8131 (16%) | 24049 (16%) | |
30-39 Yrs | 398 (11%) | 6111 (12%) | 18005 (12%) | |
40-49 Yrs | 341 (10%) | 5886 (12%) | 16511 (11%) | |
50-59 Yrs | 282 (8%) | 5146 (10%) | 16140 (11%) | |
60-69 Yrs | 536 (16%) | 6002 (12%) | 16880 (11%) | |
70+ Yrs | 293 (8%) | 5145 (10%) | 14004 (9%) | |
Median HH Income | $47,742 | $46,486 | $56,853 | |
Total Household Income | < 24K | 377 (26%) | 5302 (25%) | 11508 (20%) |
25-49K | 374 (25%) | 5989 (28%) | 13318 (23%) | |
50-74K | 240 (16%) | 4077 (19%) | 10768 (19%) | |
75-99K | 181 (12%) | 2353 (11%) | 6934 (12%) | |
100-199K | 205 (14%) | 2612 (12%) | 10388 (18%) | |
200K+ | 64 (4%) | 652 (3%) | 3032 (5%) | |
Highest Education Level | No Diploma | 274 | 3580 | 7733 |
Diploma or GED | 558 | 9458 | 24729 | |
Some College | 420 | 6835 | 18669 | |
Assoc. Degree | 170 | 2461 | 7414 | |
Bachelors Degree | 556 | 6446 | 19068 | |
Higher Degree | 321 | 3976 | 14423 | |
Total Housing Units | 1,540 | 23,973 | 62,891 | |
--Owner-Occupied | 673 | 11,086 | 35,824 | |
--Renter-Occupied | 767 | 9,898 | 20,123 | |
Owner-Occupied Values | < 100K | 118 | 4056 | 10767 |
100-199K | 253 | 4478 | 14508 | |
200-299K | 194 | 1622 | 6364 | |
300-399K | 58 | 440 | 1996 | |
400-499K | 1 | 96 | 678 | |
500K+ | 51 | 394 | 1510 | |
Total Working Age Population | 2,630 | 38,705 | 116,231 | |
In Work Force | 1,649 | 25,507 | 74,636 | |
Not In Work Force | 982 | 13,198 | 41,595 | |
Workforce Employed | 1,586 | 23,886 | 70,716 | |
Workforce Unemployed | 41 | 1,563 | 3,802 | |
Civlian Workforce | 1,627 | 25,450 | 74,518 | |
Military Workforce | 21 | 57 | 119 | |
Total Households | 1,441 | 20,984 | 55,947 | |
Family Households | 873 | 11,102 | 33,037 | |
Non-Family Households | 568 | 9,882 | 22,910 | |
Married Couple | 603 | 7,582 | 24,392 | |
Other Family | 270 | 3,520 | 8,645 | |
Married w/Child | 201 | 2,764 | 9,693 | |
Single Male w/Child | 5 | 507 | 1,237 | |
Single Female w/Child | 119 | 1,372 | 3,648 |
Population Change Last Two Decades - Plus Projection
2000 | % | 2010 | % | 2020 | % | 2030 | |
---|---|---|---|---|---|---|---|
Indiana | 6,080,485 | +7 | 6,483,802 | +4 | 6,738,573 | +4 | 7,014,880 |
St. Joseph County | 265,559 | +1 | 266,931 | +1 | 269,113 | +1 | 271,912 |
Michigan | 9,938,444 | -1 | 9,883,640 | +1 | 10,023,423 | +4 | 10,424,510 |
Cass County | 51,104 | +2 | 52,293 | -2 | 51,383 | +3 | 53,143 |
Total Working Age Population:
Total Households:
Total Working Age Population:
Total Households:
Total Working Age Population:
Total Households: