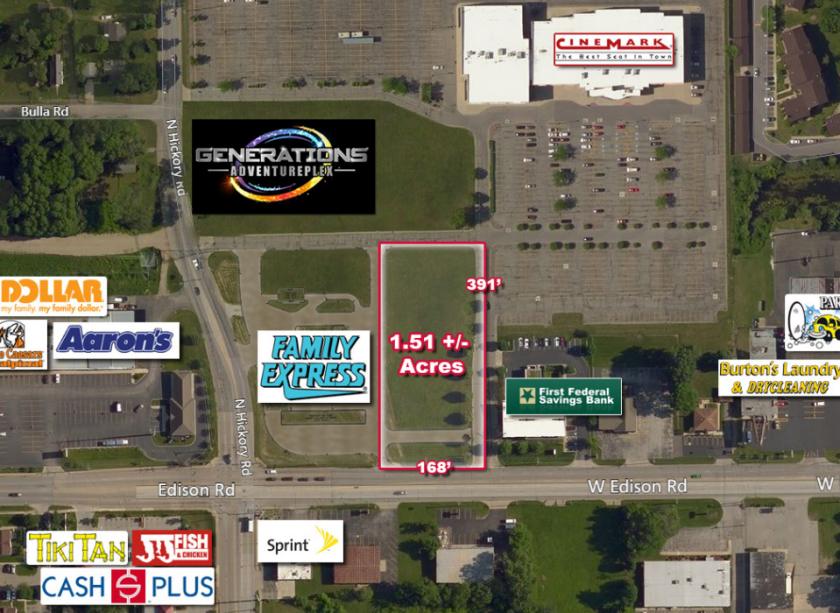
1-Mile | 3-Miles | 5-Miles | ||
---|---|---|---|---|
Total Population | 10,134 | 78,098 | 172,249 | |
Population Median Age | 40 | 36 | 37 | |
Population by Age | 0-9 Yrs | 1039 (10%) | 8398 (10%) | 21610 (12%) |
10-19 Yrs | 1119 (11%) | 12038 (15%) | 25585 (14%) | |
20-29 Yrs | 1751 (17%) | 17200 (22%) | 29891 (17%) | |
30-39 Yrs | 1466 (14%) | 9622 (12%) | 21900 (12%) | |
40-49 Yrs | 1347 (13%) | 7864 (10%) | 18857 (10%) | |
50-59 Yrs | 1142 (11%) | 6949 (8%) | 18865 (10%) | |
60-69 Yrs | 971 (9%) | 9057 (11%) | 19626 (11%) | |
70+ Yrs | 1299 (12%) | 6970 (8%) | 15915 (9%) | |
Median HH Income | $36,980 | $46,501 | $50,428 | |
Total Household Income | < 24K | 1671 (32%) | 7534 (24%) | 16046 (24%) |
25-49K | 1983 (38%) | 8993 (29%) | 17069 (25%) | |
50-74K | 722 (14%) | 6033 (19%) | 12683 (19%) | |
75-99K | 366 (7%) | 3326 (10%) | 7718 (11%) | |
100-199K | 360 (7%) | 3947 (12%) | 10217 (15%) | |
200K+ | 33 (0%) | 1053 (3%) | 2970 (4%) | |
Highest Education Level | No Diploma | 745 | 4759 | 11226 |
Diploma or GED | 2485 | 12402 | 30117 | |
Some College | 1538 | 9657 | 22257 | |
Assoc. Degree | 502 | 3482 | 9218 | |
Bachelors Degree | 1116 | 9653 | 20176 | |
Higher Degree | 724 | 7503 | 15812 | |
Total Housing Units | 6,007 | 35,909 | 76,625 | |
--Owner-Occupied | 1,774 | 15,782 | 40,147 | |
--Renter-Occupied | 3,360 | 15,104 | 26,554 | |
Owner-Occupied Values | < 100K | 909 | 6426 | 15864 |
100-199K | 711 | 6302 | 14941 | |
200-299K | 98 | 1704 | 5179 | |
300-399K | 29 | 670 | 1978 | |
400-499K | 0 | 85 | 660 | |
500K+ | 27 | 594 | 1526 | |
Total Working Age Population | 8,426 | 64,701 | 136,947 | |
In Work Force | 5,678 | 41,088 | 86,949 | |
Not In Work Force | 2,748 | 23,612 | 49,998 | |
Workforce Employed | 5,225 | 38,422 | 82,169 | |
Workforce Unemployed | 446 | 2,576 | 4,636 | |
Civlian Workforce | 5,671 | 40,998 | 86,805 | |
Military Workforce | 7 | 90 | 144 | |
Total Households | 5,134 | 30,886 | 66,702 | |
Family Households | 2,083 | 15,439 | 37,773 | |
Non-Family Households | 3,051 | 15,447 | 28,929 | |
Married Couple | 1,401 | 10,366 | 25,688 | |
Other Family | 682 | 5,073 | 12,085 | |
Married w/Child | 476 | 3,976 | 9,791 | |
Single Male w/Child | 167 | 657 | 1,594 | |
Single Female w/Child | 260 | 2,117 | 5,398 |
Population Change Last Two Decades - Plus Projection
2000 | % | 2010 | % | 2020 | % | 2030 | |
---|---|---|---|---|---|---|---|
Indiana | 6,080,485 | +7 | 6,483,802 | +4 | 6,738,573 | +4 | 7,014,880 |
St. Joseph County | 265,559 | +1 | 266,931 | +1 | 269,113 | +1 | 271,912 |
Michigan | 9,938,444 | -1 | 9,883,640 | +1 | 10,023,423 | +4 | 10,424,510 |
Berrien County | 162,453 | -3 | 156,813 | -2 | 153,154 | +2 | 156,590 |
Cass County | 51,104 | +2 | 52,293 | -2 | 51,383 | +3 | 53,143 |
Total Working Age Population:
Total Households:
Total Working Age Population:
Total Households:
Total Working Age Population:
Total Households: