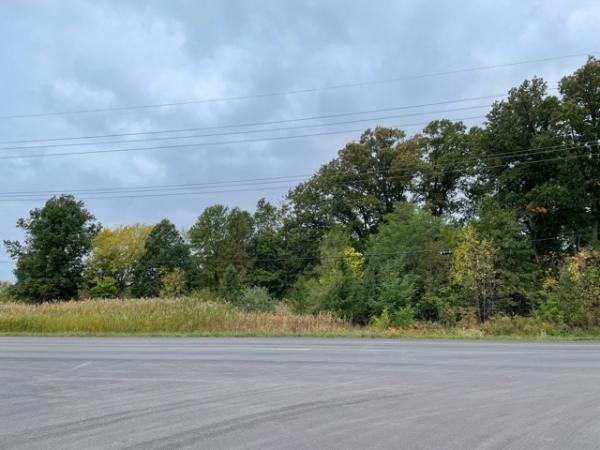
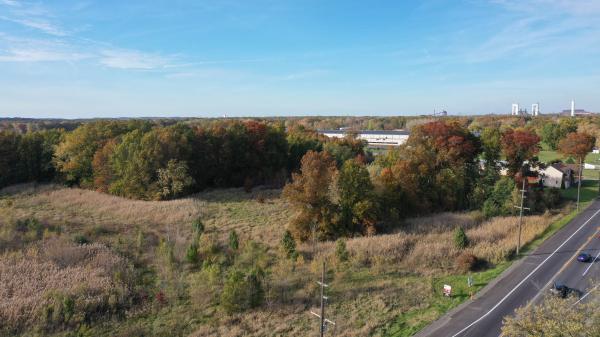
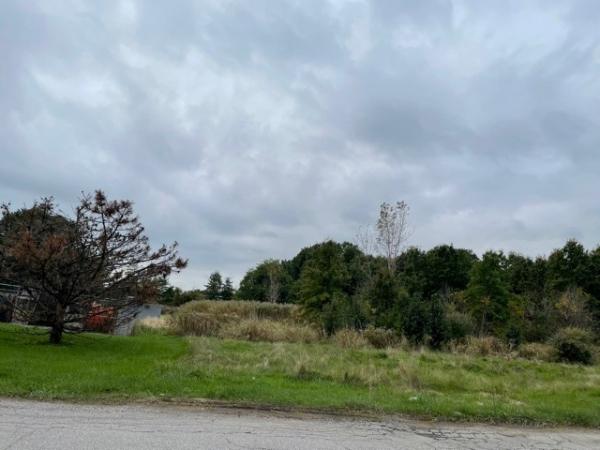
Commercial Land
SR 149 and Tech Drive Burns Harbor, IN 46304
SR 149 and Tech Drive Burns Harbor, IN 46304
Details & Description
Property Highlights
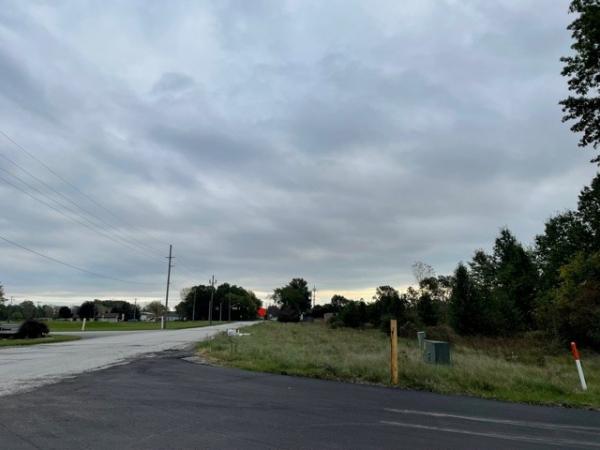
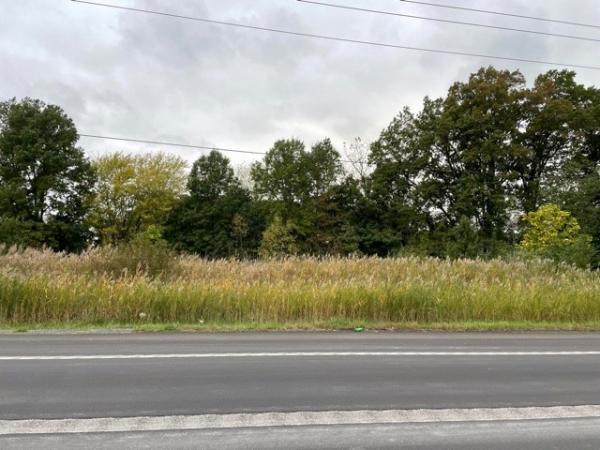
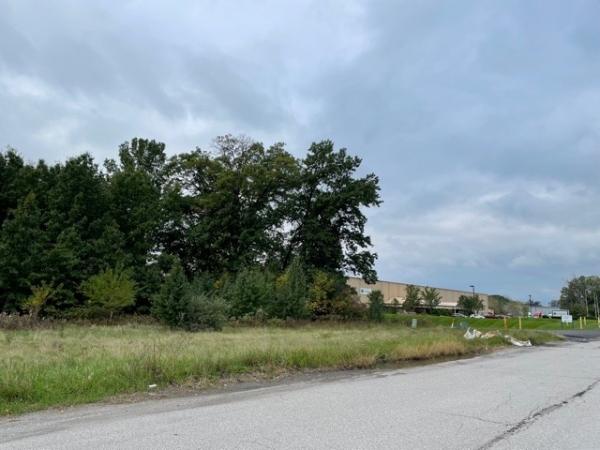
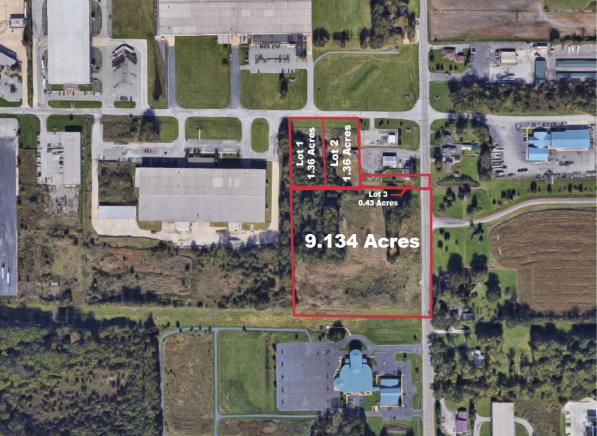
• Excellent industrial or heavy duty industrial location for servicing local manufacturers
• Great location for transportation, distribution, logistics, and warehousing companies
Additional Photos

Listing Agents

Roy Roelke
O: 574-485-1537
M: 574-286-9159
rroelke@cressy.com
O: 574-485-1537
M: 574-286-9159
rroelke@cressy.com
While we strive to provide the most accurate information, all listing information, and demographic data, is provided by third-parties. As such, MyEListing will not be responsible for the accuracy of the information. It is strongly recommended that you verify all information with the listing agent, and any relevant agencies, prior to making any decisions.