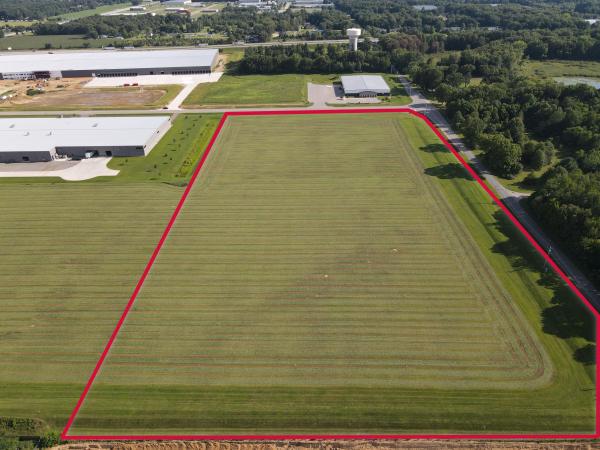
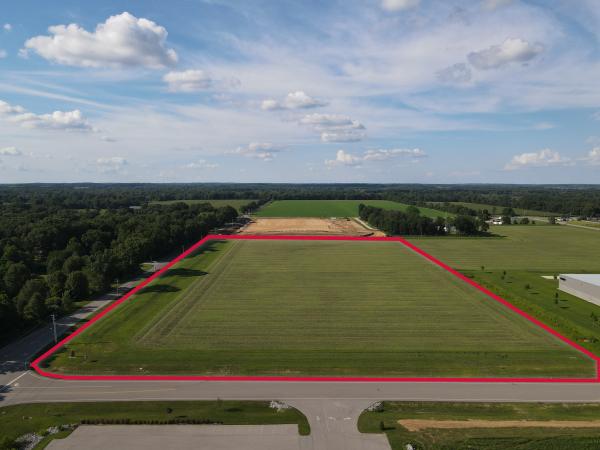
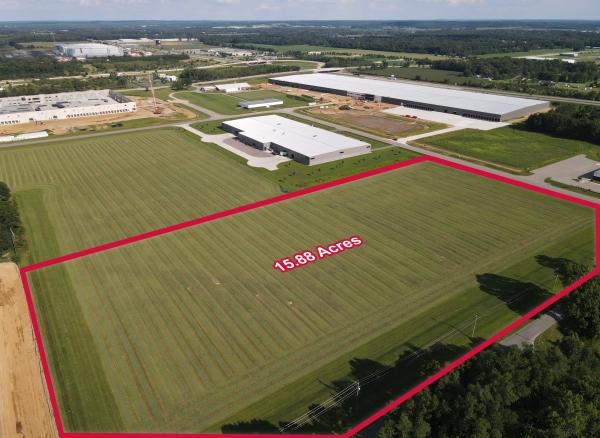
1-Mile | 3-Miles | 5-Miles | ||
---|---|---|---|---|
Total Population | 1,016 | 15,814 | 47,403 | |
Population Median Age | 39 | 41 | 40 | |
Population by Age | 0-9 Yrs | 220 (21%) | 2315 (14%) | 6001 (12%) |
10-19 Yrs | 53 (5%) | 1853 (11%) | 6317 (13%) | |
20-29 Yrs | 130 (12%) | 1623 (10%) | 5646 (11%) | |
30-39 Yrs | 127 (12%) | 1743 (11%) | 5429 (11%) | |
40-49 Yrs | 90 (8%) | 1730 (10%) | 5752 (12%) | |
50-59 Yrs | 112 (11%) | 1958 (12%) | 6562 (13%) | |
60-69 Yrs | 164 (16%) | 2367 (14%) | 5756 (12%) | |
70+ Yrs | 121 (11%) | 2225 (14%) | 5939 (12%) | |
Median HH Income | $80,242 | $66,039 | $55,238 | |
Total Household Income | < 24K | 23 (6%) | 876 (14%) | 4188 (21%) |
25-49K | 72 (21%) | 1391 (22%) | 4791 (24%) | |
50-74K | 58 (16%) | 1287 (20%) | 3676 (18%) | |
75-99K | 86 (25%) | 960 (15%) | 2714 (13%) | |
100-199K | 81 (23%) | 1430 (22%) | 3559 (18%) | |
200K+ | 23 (6%) | 295 (4%) | 680 (3%) | |
Highest Education Level | No Diploma | 105 | 1278 | 5056 |
Diploma or GED | 262 | 3667 | 10535 | |
Some College | 97 | 2321 | 6942 | |
Assoc. Degree | 61 | 860 | 2746 | |
Bachelors Degree | 111 | 1811 | 4818 | |
Higher Degree | 29 | 880 | 2216 | |
Total Housing Units | 358 | 6,700 | 21,699 | |
--Owner-Occupied | 329 | 5,041 | 13,408 | |
--Renter-Occupied | 14 | 1,197 | 6,201 | |
Owner-Occupied Values | < 100K | 44 | 668 | 3497 |
100-199K | 201 | 2884 | 6545 | |
200-299K | 38 | 883 | 1838 | |
300-399K | 34 | 371 | 826 | |
400-499K | 7 | 89 | 252 | |
500K+ | 6 | 146 | 450 | |
Total Working Age Population | 766 | 12,409 | 37,515 | |
In Work Force | 504 | 7,878 | 24,385 | |
Not In Work Force | 262 | 4,531 | 13,130 | |
Workforce Employed | 482 | 7,578 | 23,096 | |
Workforce Unemployed | 20 | 283 | 1,272 | |
Civlian Workforce | 502 | 7,862 | 24,368 | |
Military Workforce | 2 | 16 | 18 | |
Total Households | 342 | 6,239 | 19,609 | |
Family Households | 253 | 4,140 | 12,210 | |
Non-Family Households | 90 | 2,098 | 7,399 | |
Married Couple | 239 | 3,493 | 9,028 | |
Other Family | 14 | 647 | 3,182 | |
Married w/Child | 89 | 1,186 | 3,368 | |
Single Male w/Child | 2 | 113 | 510 | |
Single Female w/Child | 6 | 290 | 1,243 |
Population Change Last Two Decades - Plus Projection
2000 | % | 2010 | % | 2020 | % | 2030 | |
---|---|---|---|---|---|---|---|
Indiana | 6,080,485 | +7 | 6,483,802 | +4 | 6,738,573 | +4 | 7,014,880 |
Elkhart County | 182,791 | +8 | 197,559 | +6 | 209,690 | +7 | 223,392 |
Michigan | 9,938,444 | -1 | 9,883,640 | +1 | 10,023,423 | +4 | 10,424,510 |
Cass County | 51,104 | +2 | 52,293 | -2 | 51,383 | +3 | 53,143 |
Total Working Age Population:
Total Households:
Total Working Age Population:
Total Households:
Total Working Age Population:
Total Households: