Commercial Land
116 West Bristol Street Elkhart, IN 46514
116 West Bristol Street Elkhart, IN 46514

Details & Description
Property Highlights
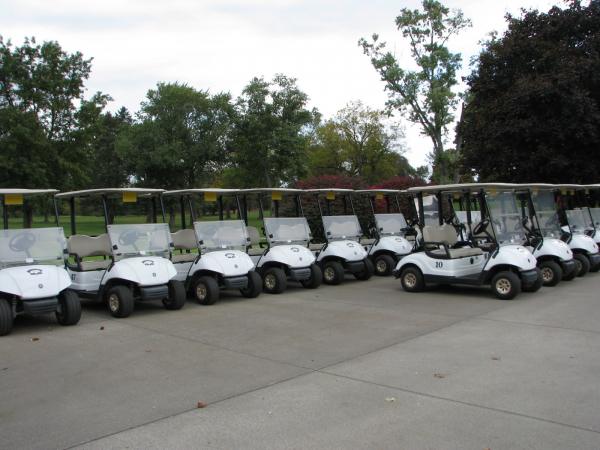
• Available for continued operation as a golf course or as a development opportunity
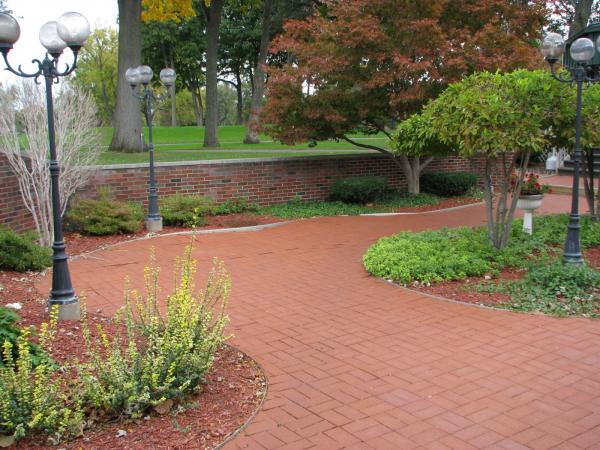
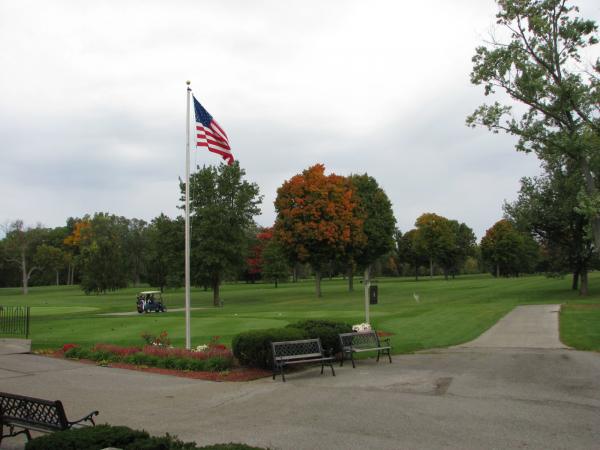
• This 136.6 acre course features a beautifully rolling landscape and mature trees
Additional Photos


Listing Agents

Ryan Gableman
O: 574-485-1502
M: 574-485-1502
rgableman@cressy.com
O: 574-485-1502
M: 574-485-1502
rgableman@cressy.com

Timothy Mehall
O: 574-271-4060
M: 574-485-1516
tmehall@cressy.com
O: 574-271-4060
M: 574-485-1516
tmehall@cressy.com
While we strive to provide the most accurate information, all listing information, and demographic data, is provided by third-parties. As such, MyEListing will not be responsible for the accuracy of the information. It is strongly recommended that you verify all information with the listing agent, and any relevant agencies, prior to making any decisions.