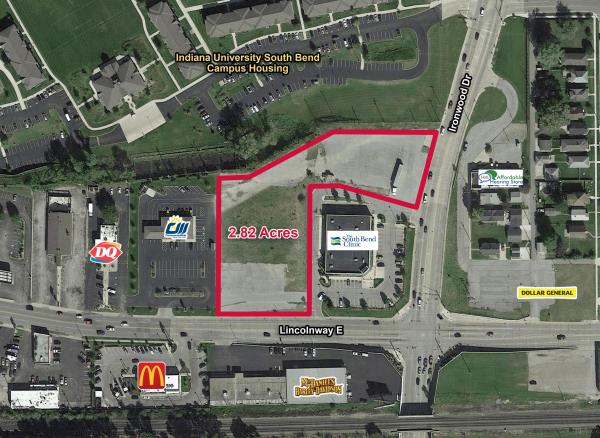
1-Mile | 3-Miles | 5-Miles | ||
---|---|---|---|---|
Total Population | 14,317 | 88,988 | 165,318 | |
Population Median Age | 34 | 36 | 36 | |
Population by Age | 0-9 Yrs | 1856 (12%) | 11752 (13%) | 21071 (12%) |
10-19 Yrs | 2545 (17%) | 12404 (13%) | 25231 (15%) | |
20-29 Yrs | 2433 (16%) | 15661 (17%) | 29805 (18%) | |
30-39 Yrs | 2301 (16%) | 11987 (13%) | 21234 (12%) | |
40-49 Yrs | 1580 (11%) | 10032 (11%) | 17802 (10%) | |
50-59 Yrs | 1448 (10%) | 9198 (10%) | 16985 (10%) | |
60-69 Yrs | 1241 (8%) | 10158 (11%) | 18571 (11%) | |
70+ Yrs | 913 (6%) | 7796 (8%) | 14618 (8%) | |
Median HH Income | $42,673 | $44,042 | $44,631 | |
Total Household Income | < 24K | 1486 (27%) | 9780 (27%) | 17554 (27%) |
25-49K | 1682 (30%) | 10138 (28%) | 17511 (27%) | |
50-74K | 1167 (21%) | 6913 (19%) | 12533 (19%) | |
75-99K | 462 (8%) | 3766 (10%) | 6703 (10%) | |
100-199K | 495 (9%) | 4032 (11%) | 7800 (12%) | |
200K+ | 187 (3%) | 911 (2%) | 1716 (2%) | |
Highest Education Level | No Diploma | 828 | 6434 | 12876 |
Diploma or GED | 2621 | 16649 | 31218 | |
Some College | 2014 | 11897 | 21495 | |
Assoc. Degree | 932 | 4739 | 8250 | |
Bachelors Degree | 1387 | 9721 | 16789 | |
Higher Degree | 782 | 7057 | 12421 | |
Total Housing Units | 6,232 | 41,581 | 74,000 | |
--Owner-Occupied | 3,313 | 19,809 | 36,035 | |
--Renter-Occupied | 2,165 | 15,732 | 27,783 | |
Owner-Occupied Values | < 100K | 2396 | 10516 | 17965 |
100-199K | 688 | 6997 | 12962 | |
200-299K | 133 | 1133 | 2827 | |
300-399K | 18 | 482 | 1099 | |
400-499K | 7 | 130 | 263 | |
500K+ | 71 | 552 | 920 | |
Total Working Age Population | 11,305 | 70,701 | 130,743 | |
In Work Force | 7,711 | 44,747 | 82,337 | |
Not In Work Force | 3,594 | 25,954 | 48,406 | |
Workforce Employed | 7,193 | 41,994 | 77,123 | |
Workforce Unemployed | 518 | 2,713 | 5,106 | |
Civlian Workforce | 7,711 | 44,707 | 82,229 | |
Military Workforce | 0 | 40 | 108 | |
Total Households | 5,478 | 35,541 | 63,818 | |
Family Households | 2,948 | 18,631 | 34,821 | |
Non-Family Households | 2,530 | 16,910 | 28,997 | |
Married Couple | 1,687 | 11,580 | 22,078 | |
Other Family | 1,261 | 7,050 | 12,743 | |
Married w/Child | 789 | 4,482 | 8,484 | |
Single Male w/Child | 154 | 932 | 1,555 | |
Single Female w/Child | 690 | 3,090 | 5,819 |
Population Change Last Two Decades - Plus Projection
2000 | % | 2010 | % | 2020 | % | 2030 | |
---|---|---|---|---|---|---|---|
Indiana | 6,080,485 | +7 | 6,483,802 | +4 | 6,738,573 | +4 | 7,014,880 |
St. Joseph County | 265,559 | +1 | 266,931 | +1 | 269,113 | +1 | 271,912 |
Total Working Age Population:
Total Households:
Total Working Age Population:
Total Households:
Total Working Age Population:
Total Households: