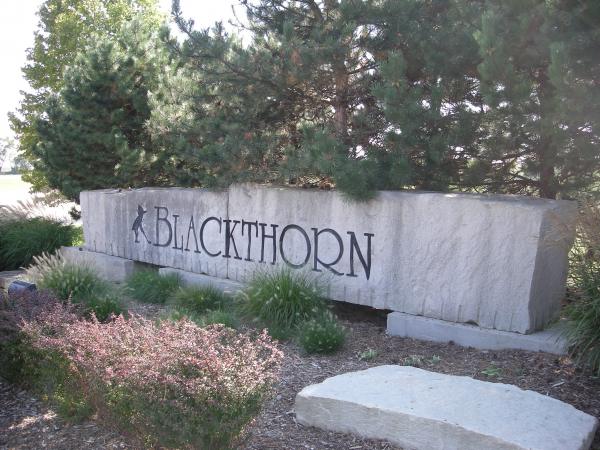
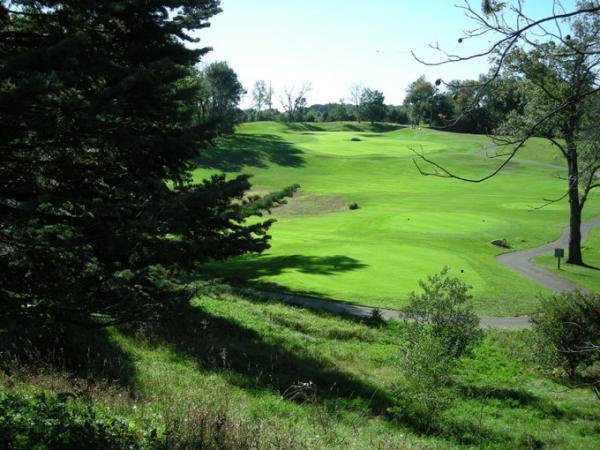
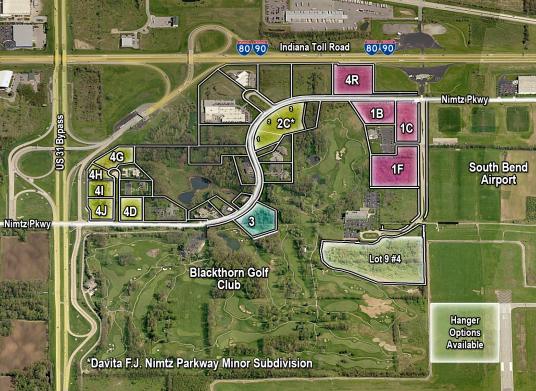
1-Mile | 3-Miles | 5-Miles | ||
---|---|---|---|---|
Total Population | 730 | 19,113 | 75,420 | |
Population Median Age | 44 | 40 | 37 | |
Population by Age | 0-9 Yrs | 45 (6%) | 2217 (11%) | 8808 (11%) |
10-19 Yrs | 66 (9%) | 2087 (10%) | 12581 (16%) | |
20-29 Yrs | 97 (13%) | 2629 (13%) | 13300 (17%) | |
30-39 Yrs | 56 (7%) | 2322 (12%) | 8248 (10%) | |
40-49 Yrs | 161 (22%) | 2590 (13%) | 8219 (10%) | |
50-59 Yrs | 124 (16%) | 2627 (13%) | 8785 (11%) | |
60-69 Yrs | 91 (12%) | 2462 (12%) | 8709 (11%) | |
70+ Yrs | 90 (12%) | 2179 (11%) | 6771 (8%) | |
Median HH Income | $78,782 | $53,553 | $47,648 | |
Total Household Income | < 24K | 36 (12%) | 1491 (19%) | 6944 (25%) |
25-49K | 43 (14%) | 2222 (28%) | 7002 (26%) | |
50-74K | 59 (20%) | 1265 (16%) | 4959 (18%) | |
75-99K | 53 (18%) | 1013 (13%) | 2926 (10%) | |
100-199K | 83 (28%) | 1584 (20%) | 4133 (15%) | |
200K+ | 18 (6%) | 177 (2%) | 873 (3%) | |
Highest Education Level | No Diploma | 29 | 1275 | 6509 |
Diploma or GED | 182 | 4286 | 14686 | |
Some College | 116 | 2775 | 9183 | |
Assoc. Degree | 38 | 1489 | 4159 | |
Bachelors Degree | 151 | 2526 | 6349 | |
Higher Degree | 60 | 1296 | 5201 | |
Total Housing Units | 292 | 8,662 | 30,840 | |
--Owner-Occupied | 289 | 5,500 | 18,053 | |
--Renter-Occupied | 4 | 2,251 | 8,783 | |
Owner-Occupied Values | < 100K | 24 | 1936 | 8422 |
100-199K | 196 | 2567 | 6804 | |
200-299K | 50 | 641 | 1703 | |
300-399K | 5 | 148 | 520 | |
400-499K | 0 | 56 | 179 | |
500K+ | 14 | 151 | 425 | |
Total Working Age Population | 622 | 15,342 | 60,156 | |
In Work Force | 414 | 10,192 | 36,859 | |
Not In Work Force | 208 | 5,150 | 23,297 | |
Workforce Employed | 402 | 9,849 | 34,850 | |
Workforce Unemployed | 13 | 339 | 1,944 | |
Civlian Workforce | 414 | 10,188 | 36,794 | |
Military Workforce | 0 | 4 | 65 | |
Total Households | 292 | 7,751 | 26,837 | |
Family Households | 196 | 4,878 | 16,183 | |
Non-Family Households | 96 | 2,873 | 10,653 | |
Married Couple | 175 | 3,545 | 10,888 | |
Other Family | 21 | 1,333 | 5,296 | |
Married w/Child | 70 | 1,356 | 4,323 | |
Single Male w/Child | 10 | 101 | 454 | |
Single Female w/Child | 0 | 595 | 2,603 |
Population Change Last Two Decades - Plus Projection
2000 | % | 2010 | % | 2020 | % | 2030 | |
---|---|---|---|---|---|---|---|
Indiana | 6,080,485 | +7 | 6,483,802 | +4 | 6,738,573 | +4 | 7,014,880 |
St. Joseph County | 265,559 | +1 | 266,931 | +1 | 269,113 | +1 | 271,912 |
Michigan | 9,938,444 | -1 | 9,883,640 | +1 | 10,023,423 | +4 | 10,424,510 |
Berrien County | 162,453 | -3 | 156,813 | -2 | 153,154 | +2 | 156,590 |
Total Working Age Population:
Total Households:
Total Working Age Population:
Total Households:
Total Working Age Population:
Total Households: