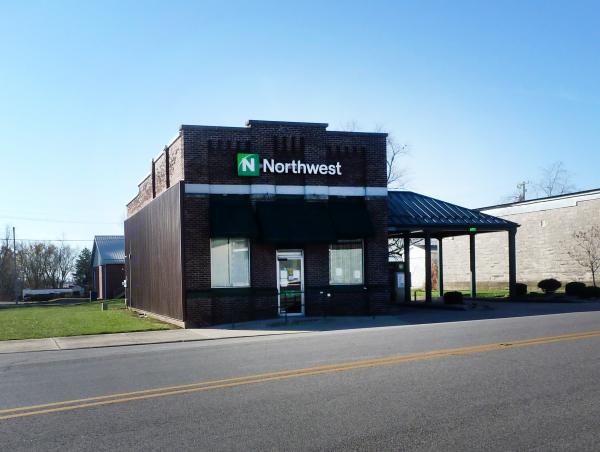
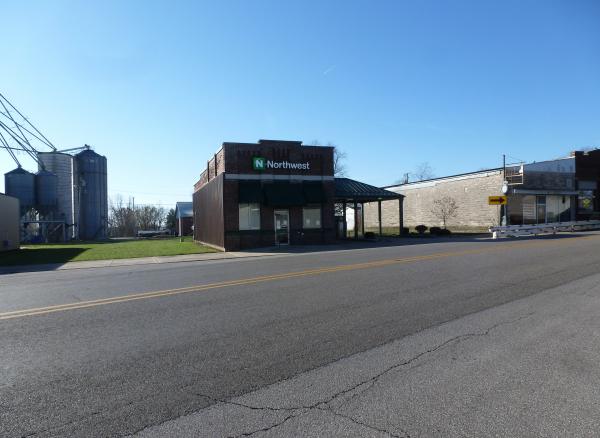
1-Mile | 3-Miles | 5-Miles | ||
---|---|---|---|---|
Total Population | 900 | 1,255 | 3,135 | |
Population Median Age | 41 | 42 | 44 | |
Population by Age | 0-9 Yrs | 116 (12%) | 130 (10%) | 296 (9%) |
10-19 Yrs | 113 (12%) | 180 (14%) | 436 (13%) | |
20-29 Yrs | 124 (13%) | 143 (11%) | 313 (9%) | |
30-39 Yrs | 98 (10%) | 143 (11%) | 377 (12%) | |
40-49 Yrs | 74 (8%) | 120 (9%) | 345 (11%) | |
50-59 Yrs | 123 (13%) | 146 (11%) | 337 (10%) | |
60-69 Yrs | 118 (13%) | 182 (14%) | 456 (14%) | |
70+ Yrs | 135 (15%) | 211 (16%) | 575 (18%) | |
Median HH Income | $44,223 | $46,549 | $47,834 | |
Total Household Income | < 24K | 87 (27%) | 105 (23%) | 287 (23%) |
25-49K | 90 (28%) | 132 (29%) | 345 (28%) | |
50-74K | 71 (22%) | 99 (22%) | 242 (20%) | |
75-99K | 22 (7%) | 32 (7%) | 141 (11%) | |
100-199K | 20 (6%) | 47 (10%) | 149 (12%) | |
200K+ | 22 (7%) | 30 (6%) | 44 (3%) | |
Highest Education Level | No Diploma | 72 | 110 | 344 |
Diploma or GED | 339 | 441 | 856 | |
Some College | 92 | 143 | 434 | |
Assoc. Degree | 90 | 123 | 301 | |
Bachelors Degree | 23 | 43 | 195 | |
Higher Degree | 4 | 19 | 93 | |
Total Housing Units | 374 | 553 | 1,493 | |
--Owner-Occupied | 195 | 318 | 893 | |
--Renter-Occupied | 117 | 127 | 316 | |
Owner-Occupied Values | < 100K | 133 | 200 | 487 |
100-199K | 58 | 94 | 306 | |
200-299K | 2 | 19 | 85 | |
300-399K | 2 | 5 | 16 | |
400-499K | 0 | 0 | 0 | |
500K+ | 0 | 0 | 0 | |
Total Working Age Population | 726 | 1,028 | 2,610 | |
In Work Force | 417 | 581 | 1,389 | |
Not In Work Force | 309 | 447 | 1,221 | |
Workforce Employed | 413 | 549 | 1,283 | |
Workforce Unemployed | 4 | 32 | 104 | |
Civlian Workforce | 417 | 581 | 1,388 | |
Military Workforce | 0 | 0 | 1 | |
Total Households | 312 | 445 | 1,209 | |
Family Households | 194 | 302 | 845 | |
Non-Family Households | 118 | 143 | 363 | |
Married Couple | 132 | 236 | 699 | |
Other Family | 62 | 66 | 147 | |
Married w/Child | 41 | 66 | 214 | |
Single Male w/Child | 15 | 15 | 22 | |
Single Female w/Child | 33 | 36 | 69 |
Population Change Last Two Decades - Plus Projection
2000 | % | 2010 | % | 2020 | % | 2030 | |
---|---|---|---|---|---|---|---|
Indiana | 6,080,485 | +7 | 6,483,802 | +4 | 6,738,573 | +4 | 7,014,880 |
Greene County | 33,157 | 0 | 33,165 | -4 | 31,803 | -4 | 30,668 |
Total Working Age Population:
Total Households:
Total Working Age Population:
Total Households:
Total Working Age Population:
Total Households: