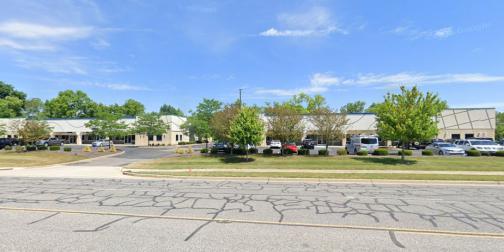
Flex-Office-Warehouse
10330 - 10340 Pleasant St Noblesville, IN 46060
10330 - 10340 Pleasant St Noblesville, IN 46060

Details & Description
Property Highlights
• Minutes from Interstate 69, Interstate 465 on the Northeast side of Indianapolis and Downtown Noblesville
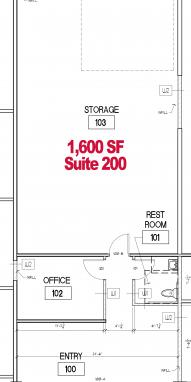
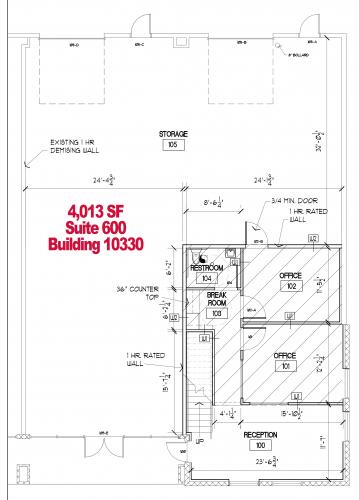
• Featuring 4" concrete floors, grade level overhead doors and 200amp electrical service
Additional Photos

Listing Agents

Andrew Follman
O: 317-566-5614
M: 317-294-3576
afollman@cressy.com
O: 317-566-5614
M: 317-294-3576
afollman@cressy.com
While we strive to provide the most accurate information, all listing information, and demographic data, is provided by third-parties. As such, MyEListing will not be responsible for the accuracy of the information. It is strongly recommended that you verify all information with the listing agent, and any relevant agencies, prior to making any decisions.


