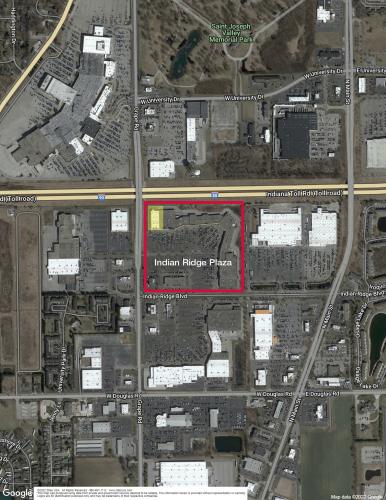
Retail Space
5946 Grape Road Mishawaka, IN 46545
5946 Grape Road Mishawaka, IN 46545
Details & Description
Property Highlights
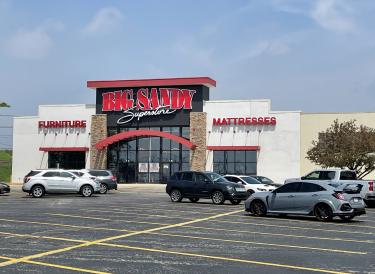
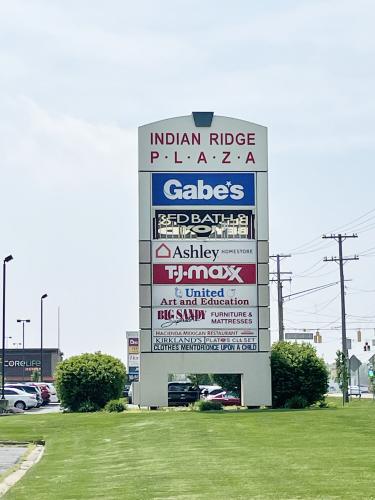
• Other anchors include TJ Maxx, Bed Bath & Beyond, Ashley Furniture & Gabes
• Incredible visibility from Grape Rd. with Indiana Toll Road exposure
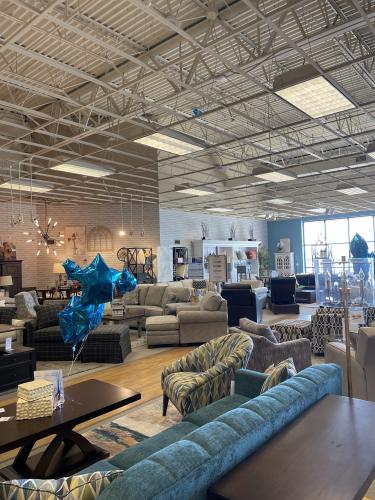
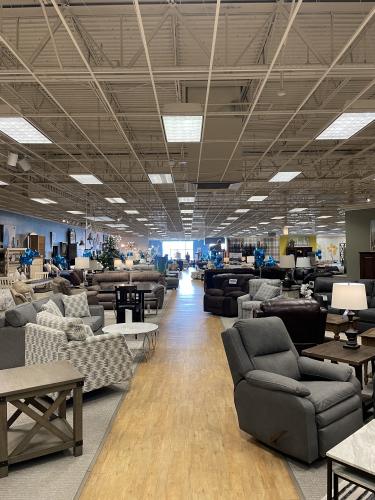
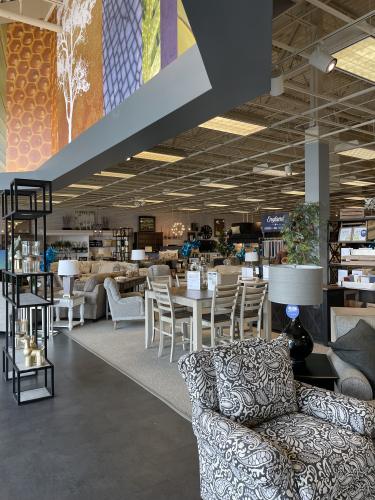
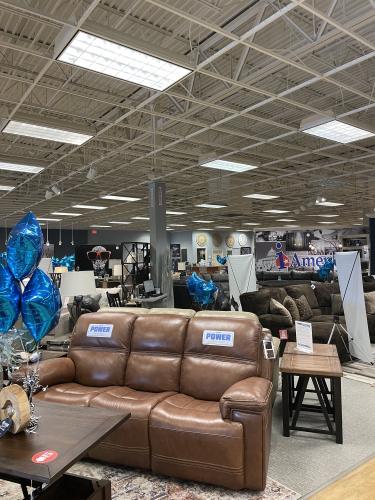
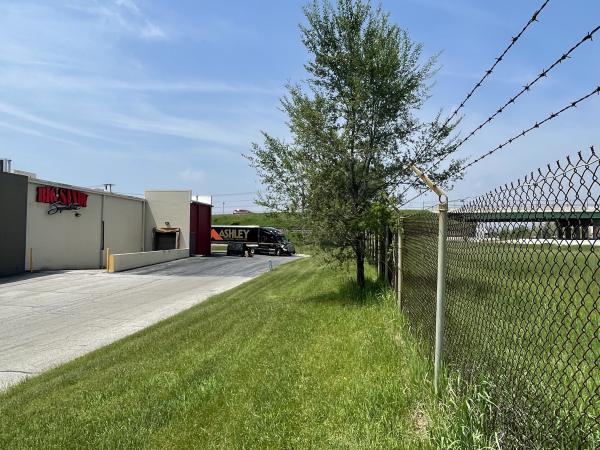
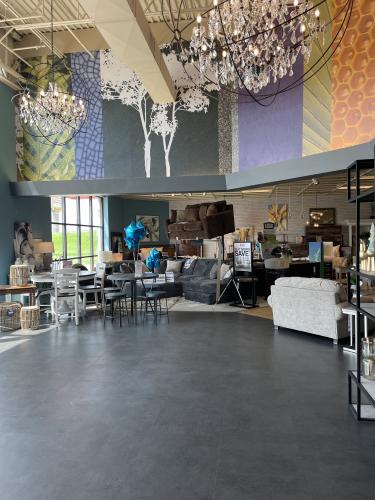
Additional Photos
Listing Agents

Timothy Mehall
O: 574-271-4060
M: 574-485-1516
tmehall@cressy.com
O: 574-271-4060
M: 574-485-1516
tmehall@cressy.com
While we strive to provide the most accurate information, all listing information, and demographic data, is provided by third-parties. As such, MyEListing will not be responsible for the accuracy of the information. It is strongly recommended that you verify all information with the listing agent, and any relevant agencies, prior to making any decisions.