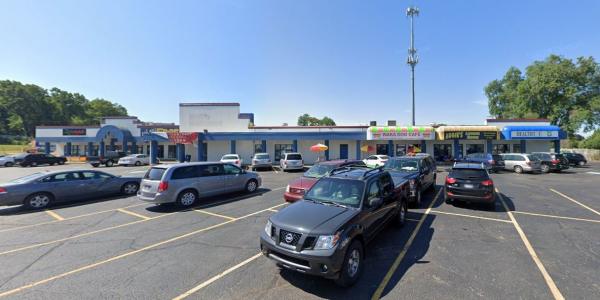
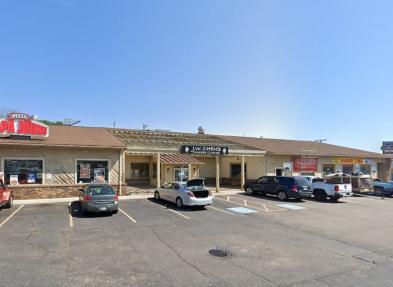
1-Mile | 3-Miles | 5-Miles | ||
---|---|---|---|---|
Total Population | 11,629 | 85,488 | 178,227 | |
Population Median Age | 32 | 36 | 37 | |
Population by Age | 0-9 Yrs | 769 (6%) | 8514 (9%) | 22704 (12%) |
10-19 Yrs | 2680 (23%) | 13779 (16%) | 26356 (14%) | |
20-29 Yrs | 3907 (33%) | 18810 (22%) | 30923 (17%) | |
30-39 Yrs | 981 (8%) | 10526 (12%) | 22876 (12%) | |
40-49 Yrs | 864 (7%) | 8579 (10%) | 19444 (10%) | |
50-59 Yrs | 634 (5%) | 8190 (9%) | 19141 (10%) | |
60-69 Yrs | 963 (8%) | 9495 (11%) | 20480 (11%) | |
70+ Yrs | 832 (7%) | 7595 (8%) | 16304 (9%) | |
Median HH Income | $46,487 | $45,251 | $47,300 | |
Total Household Income | < 24K | 796 (22%) | 8679 (25%) | 17827 (25%) |
25-49K | 1118 (31%) | 9446 (28%) | 18406 (26%) | |
50-74K | 623 (17%) | 6414 (19%) | 13011 (18%) | |
75-99K | 342 (9%) | 3453 (10%) | 7705 (11%) | |
100-199K | 552 (15%) | 4262 (12%) | 9673 (13%) | |
200K+ | 119 (3%) | 1136 (3%) | 2616 (3%) | |
Highest Education Level | No Diploma | 349 | 5353 | 13038 |
Diploma or GED | 948 | 13136 | 32097 | |
Some College | 774 | 10713 | 22864 | |
Assoc. Degree | 288 | 4004 | 9657 | |
Bachelors Degree | 1520 | 9728 | 19491 | |
Higher Degree | 1326 | 8653 | 15333 | |
Total Housing Units | 4,343 | 39,302 | 79,751 | |
--Owner-Occupied | 1,818 | 16,812 | 40,623 | |
--Renter-Occupied | 1,732 | 16,579 | 28,616 | |
Owner-Occupied Values | < 100K | 486 | 7257 | 18111 |
100-199K | 897 | 6618 | 14521 | |
200-299K | 138 | 1694 | 4325 | |
300-399K | 57 | 604 | 1770 | |
400-499K | 6 | 87 | 560 | |
500K+ | 234 | 551 | 1336 | |
Total Working Age Population | 10,269 | 71,132 | 141,391 | |
In Work Force | 5,343 | 44,576 | 89,393 | |
Not In Work Force | 4,927 | 26,557 | 51,998 | |
Workforce Employed | 5,165 | 41,957 | 84,055 | |
Workforce Unemployed | 163 | 2,528 | 5,207 | |
Civlian Workforce | 5,328 | 44,485 | 89,262 | |
Military Workforce | 15 | 91 | 131 | |
Total Households | 3,550 | 33,390 | 69,239 | |
Family Households | 1,649 | 16,580 | 38,594 | |
Non-Family Households | 1,901 | 16,810 | 30,645 | |
Married Couple | 1,211 | 10,992 | 25,465 | |
Other Family | 438 | 5,589 | 13,129 | |
Married w/Child | 454 | 3,972 | 9,810 | |
Single Male w/Child | 110 | 688 | 1,471 | |
Single Female w/Child | 200 | 2,535 | 6,101 |
Population Change Last Two Decades - Plus Projection
2000 | % | 2010 | % | 2020 | % | 2030 | |
---|---|---|---|---|---|---|---|
Indiana | 6,080,485 | +7 | 6,483,802 | +4 | 6,738,573 | +4 | 7,014,880 |
St. Joseph County | 265,559 | +1 | 266,931 | +1 | 269,113 | +1 | 271,912 |
Michigan | 9,938,444 | -1 | 9,883,640 | +1 | 10,023,423 | +4 | 10,424,510 |
Berrien County | 162,453 | -3 | 156,813 | -2 | 153,154 | +2 | 156,590 |
Cass County | 51,104 | +2 | 52,293 | -2 | 51,383 | +3 | 53,143 |
Total Working Age Population:
Total Households:
Total Working Age Population:
Total Households:
Total Working Age Population:
Total Households: