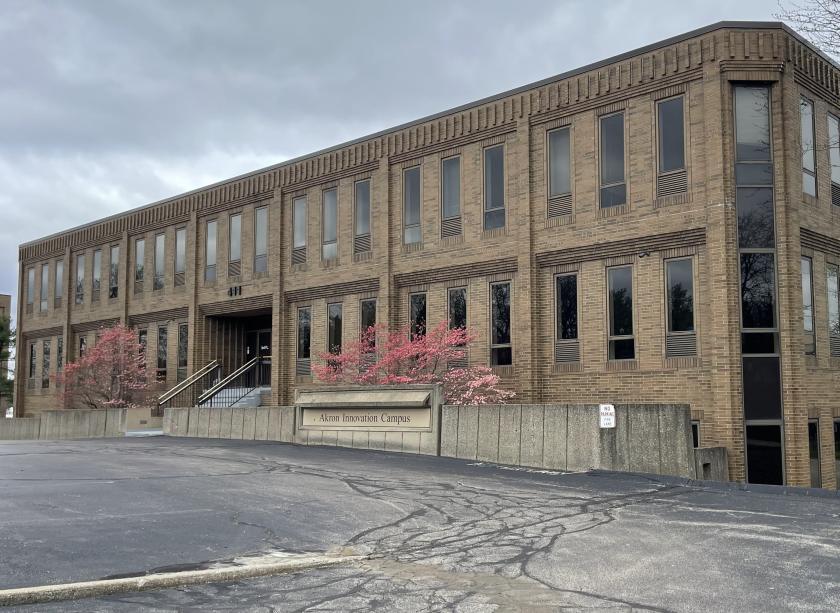
1-Mile | 3-Miles | 5-Miles | ||
---|---|---|---|---|
Total Population | 12,697 | 117,173 | 227,124 | |
Population Median Age | 31 | 37 | 39 | |
Population by Age | 0-9 Yrs | 729 (5%) | 15121 (12%) | 27204 (11%) |
10-19 Yrs | 2623 (20%) | 14953 (12%) | 26725 (11%) | |
20-29 Yrs | 4958 (39%) | 21615 (18%) | 37616 (16%) | |
30-39 Yrs | 1092 (8%) | 13981 (11%) | 29342 (12%) | |
40-49 Yrs | 812 (6%) | 13221 (11%) | 26496 (11%) | |
50-59 Yrs | 1035 (8%) | 14694 (12%) | 29583 (13%) | |
60-69 Yrs | 877 (6%) | 13109 (11%) | 27482 (12%) | |
70+ Yrs | 572 (4%) | 10479 (8%) | 22677 (9%) | |
Median HH Income | $18,928 | $34,824 | $42,382 | |
Total Household Income | < 24K | 2653 (59%) | 18112 (36%) | 29279 (29%) |
25-49K | 1156 (26%) | 14180 (28%) | 27236 (27%) | |
50-74K | 386 (8%) | 7960 (16%) | 18261 (18%) | |
75-99K | 132 (2%) | 4518 (9%) | 11594 (11%) | |
100-199K | 105 (2%) | 3844 (7%) | 10949 (11%) | |
200K+ | 11 (0%) | 485 (0%) | 1474 (1%) | |
Highest Education Level | No Diploma | 1079 | 11020 | 18515 |
Diploma or GED | 1623 | 27265 | 52601 | |
Some College | 1443 | 18578 | 36298 | |
Assoc. Degree | 451 | 5887 | 13545 | |
Bachelors Degree | 594 | 8636 | 22535 | |
Higher Degree | 386 | 4549 | 11456 | |
Total Housing Units | 5,454 | 56,762 | 110,221 | |
--Owner-Occupied | 594 | 22,456 | 51,830 | |
--Renter-Occupied | 3,850 | 26,642 | 46,963 | |
Owner-Occupied Values | < 100K | 508 | 17889 | 30178 |
100-199K | 78 | 3464 | 17375 | |
200-299K | 7 | 572 | 2867 | |
300-399K | 0 | 196 | 602 | |
400-499K | 0 | 68 | 266 | |
500K+ | 0 | 268 | 542 | |
Total Working Age Population | 11,523 | 94,533 | 184,974 | |
In Work Force | 6,019 | 58,402 | 118,580 | |
Not In Work Force | 5,504 | 36,131 | 66,394 | |
Workforce Employed | 5,302 | 51,890 | 108,752 | |
Workforce Unemployed | 717 | 6,439 | 9,646 | |
Civlian Workforce | 6,019 | 58,329 | 118,398 | |
Military Workforce | 0 | 74 | 181 | |
Total Households | 4,443 | 49,099 | 98,793 | |
Family Households | 1,296 | 25,894 | 52,932 | |
Non-Family Households | 3,148 | 23,204 | 45,861 | |
Married Couple | 381 | 12,683 | 30,615 | |
Other Family | 915 | 13,211 | 22,316 | |
Married w/Child | 177 | 3,725 | 9,729 | |
Single Male w/Child | 36 | 1,538 | 2,727 | |
Single Female w/Child | 597 | 6,276 | 9,756 |
Population Change Last Two Decades - Plus Projection
2000 | % | 2010 | % | 2020 | % | 2030 | |
---|---|---|---|---|---|---|---|
Ohio | 11,353,140 | +2 | 11,536,504 | 0 | 11,574,870 | 0 | 11,615,100 |
Summit County | 542,899 | 0 | 541,781 | -1 | 534,150 | -1 | 528,990 |
Total Working Age Population:
Total Households:
Total Working Age Population:
Total Households:
Total Working Age Population:
Total Households: