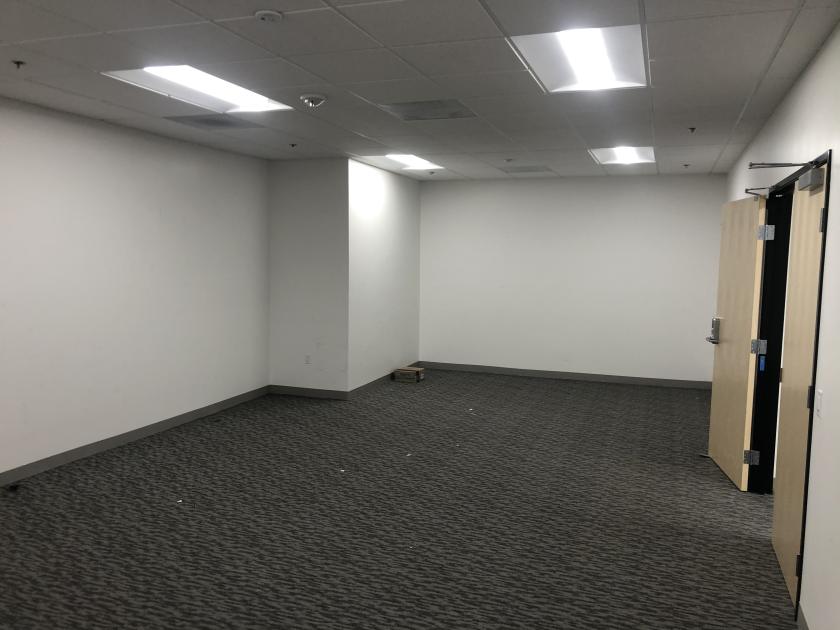
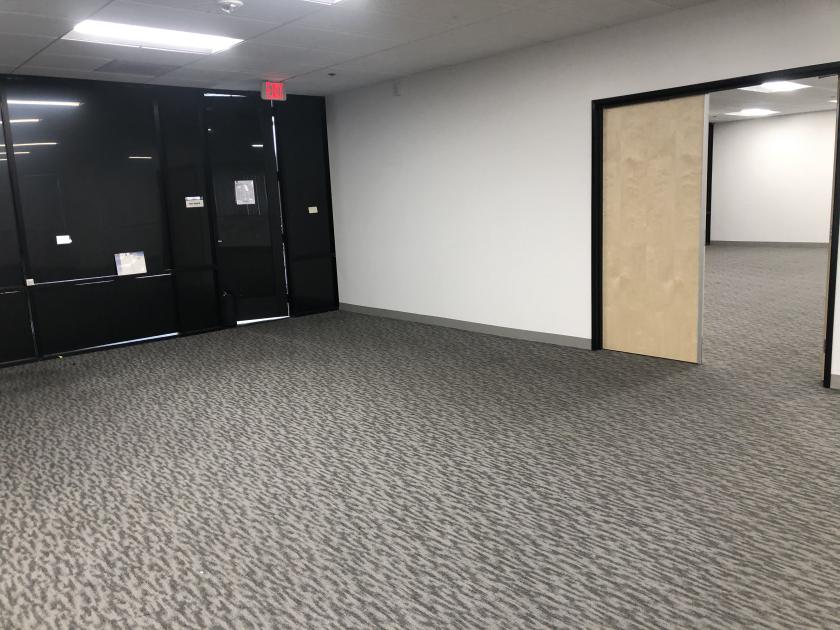
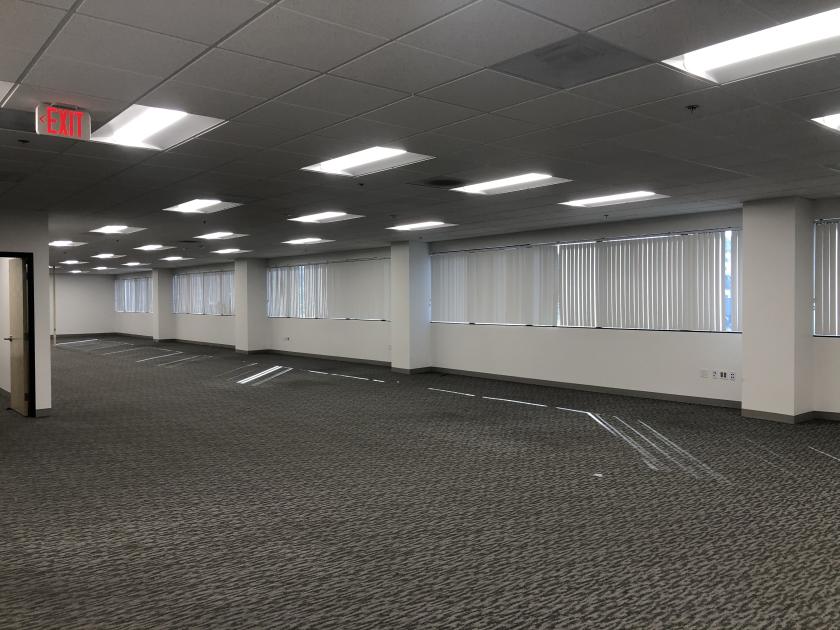
Office Space
901 West Civic Center Drive Santa Ana, CA 92703
901 West Civic Center Drive Santa Ana, CA 92703

Details & Description
Property Highlights
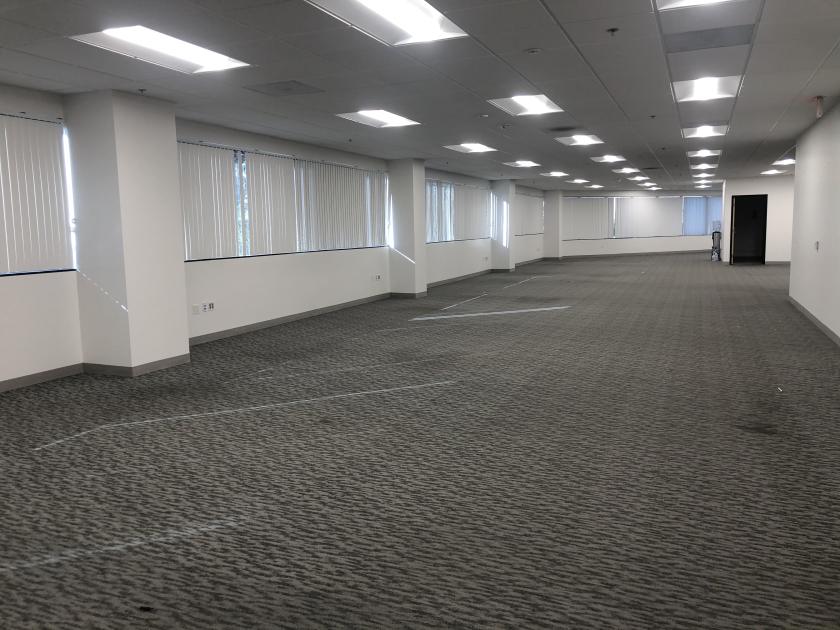
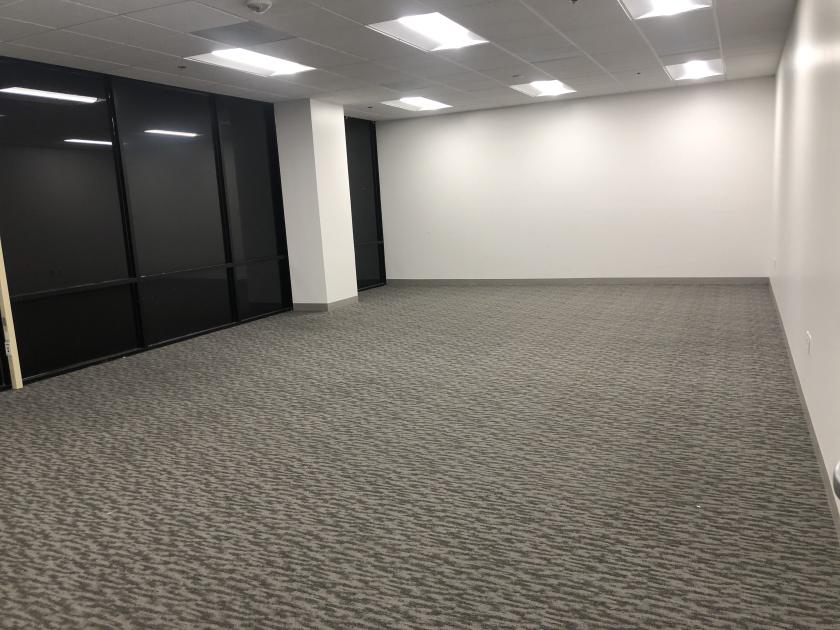
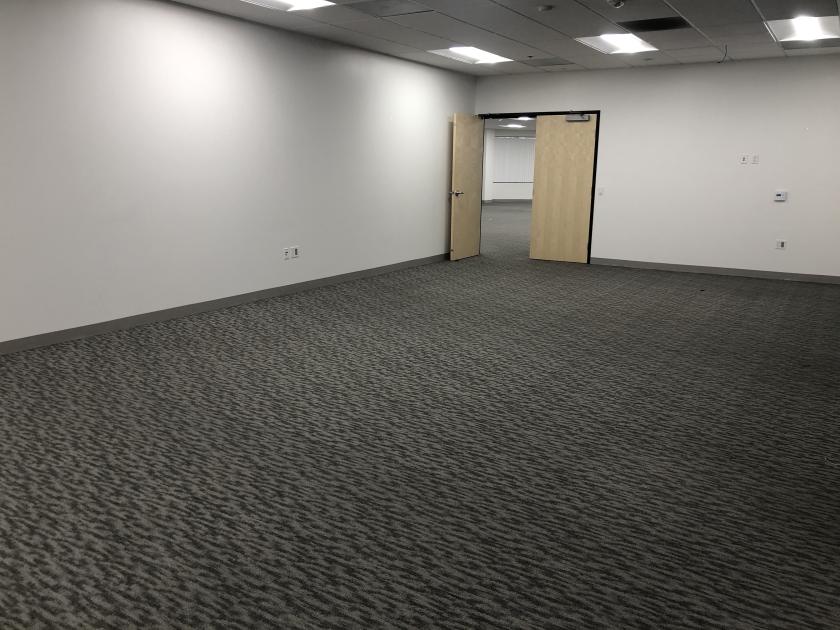
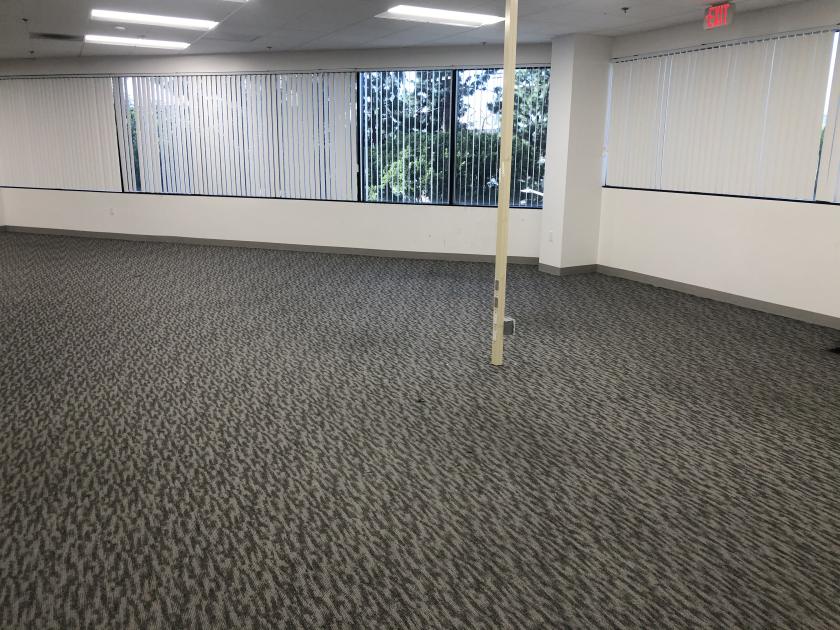
- • Remodeled professional office building.
- • Zoning permits general office and medical uses.
- • Directly across from the OC Courthouse.
- • Secure and covered parking garage.
- • Tranquil courtyard.
- • Ready for immediate occupancy.
Additional Photos
Listing Agents

Justin Hugron CCIM
O: 949-216-0469
M: 714-642-7690
justin@ashwillassociates.com
O: 949-216-0469
M: 714-642-7690
justin@ashwillassociates.com
While we strive to provide the most accurate information, all listing information, and demographic data, is provided by third-parties. As such, MyEListing will not be responsible for the accuracy of the information. It is strongly recommended that you verify all information with the listing agent, and any relevant agencies, prior to making any decisions.