Commercial Land
Powers Blvd and Airport Rd Colorado Springs, CO 80916
Powers Blvd and Airport Rd Colorado Springs, CO 80916

Details & Description
Property Highlights
• Excellent location at the west entrance of Peterson Air Force Base home of U.S. Space Command Center
• Over 67,000+ Vehicles per Day (VPD) at Powers Blvd & Airport Rd Intersection
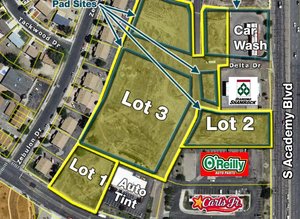
Additional Photos


Listing Agents

Craig Anderson
O: 719-667-6875
M: 719-963-6203
anderson@highlandcommercial.com
O: 719-667-6875
M: 719-963-6203
anderson@highlandcommercial.com

John Egan
NAI Highland LLC
O: 719-667-6868
M: 719-930-0877
egan@highlandcommercial.com
NAI Highland LLC
O: 719-667-6868
M: 719-930-0877
egan@highlandcommercial.com

John Onstott
O: 719-667-6870
onstott@highlandcommercial.com
O: 719-667-6870
onstott@highlandcommercial.com
While we strive to provide the most accurate information, all listing information, and demographic data, is provided by third-parties. As such, MyEListing will not be responsible for the accuracy of the information. It is strongly recommended that you verify all information with the listing agent, and any relevant agencies, prior to making any decisions.