Commercial Land
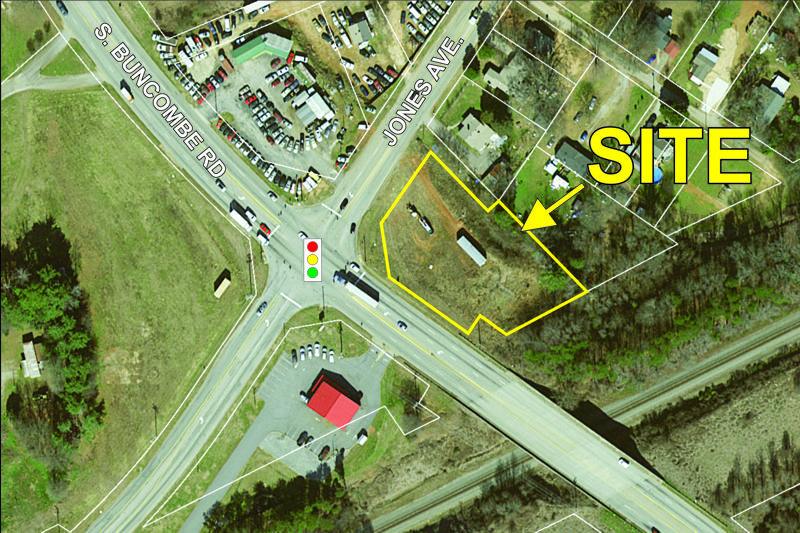
605 South Buncombe Road Greer, SC 29650
605 South Buncombe Road Greer, SC 29650
Details & Description
Property Highlights
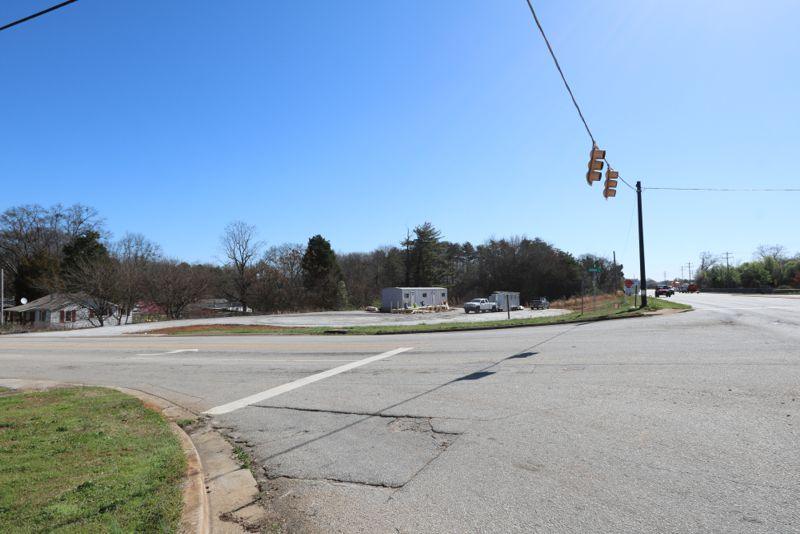
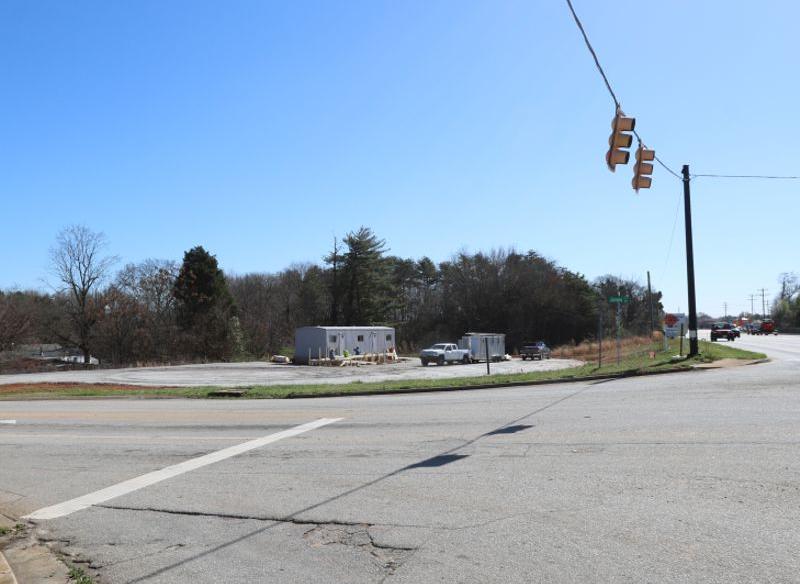
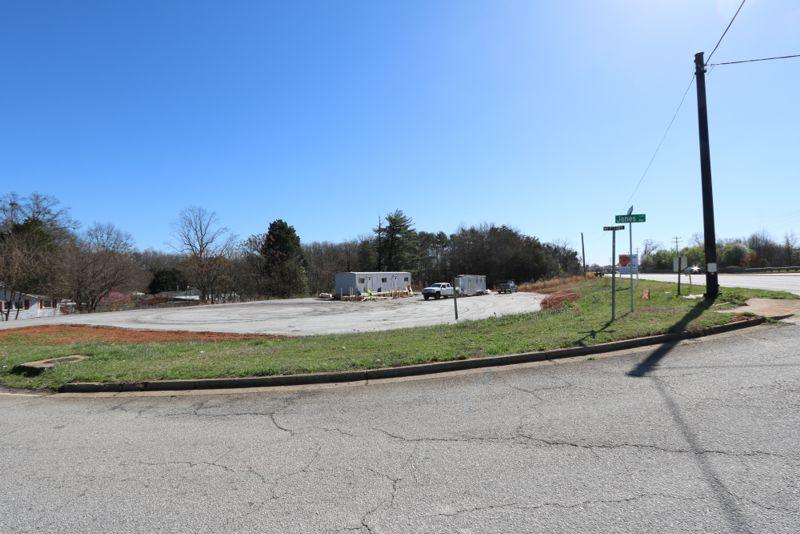
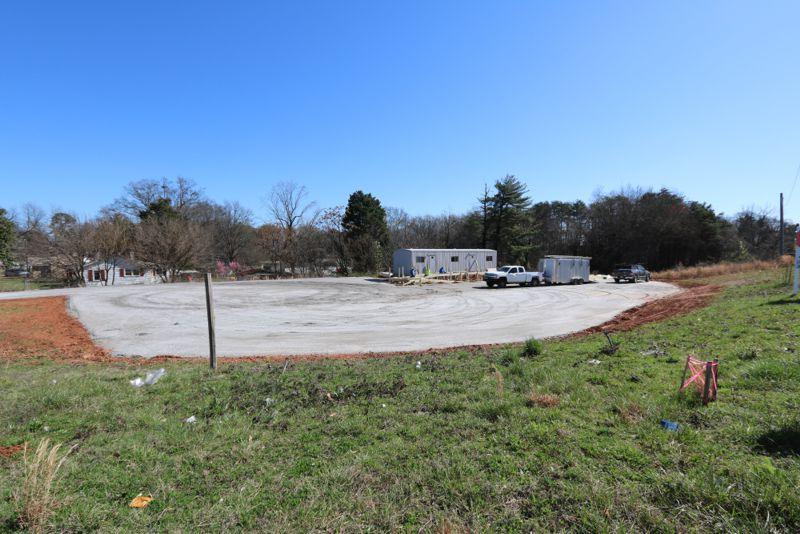
- • Paved parking lot
- • Office trailer
- • Water detention in place
- • Close to Greer Memorial Hospital
- • In Greer city limits
Additional Photos

Listing Agents

Rick Hammett
O: 864-848-9070
M: 864-313-9507
rhammett@langston-black.com
O: 864-848-9070
M: 864-313-9507
rhammett@langston-black.com
Chuck Langston
O: 864-848-9070
M: 864-230-4302
clangston@langston-black.com
O: 864-848-9070
M: 864-230-4302
clangston@langston-black.com
While we strive to provide the most accurate information, all listing information, and demographic data, is provided by third-parties. As such, MyEListing will not be responsible for the accuracy of the information. It is strongly recommended that you verify all information with the listing agent, and any relevant agencies, prior to making any decisions.