Commercial Land
423 Wilson Bridge Road Simpsonville, SC 29680
423 Wilson Bridge Road Simpsonville, SC 29680
Details & Description
Property Highlights
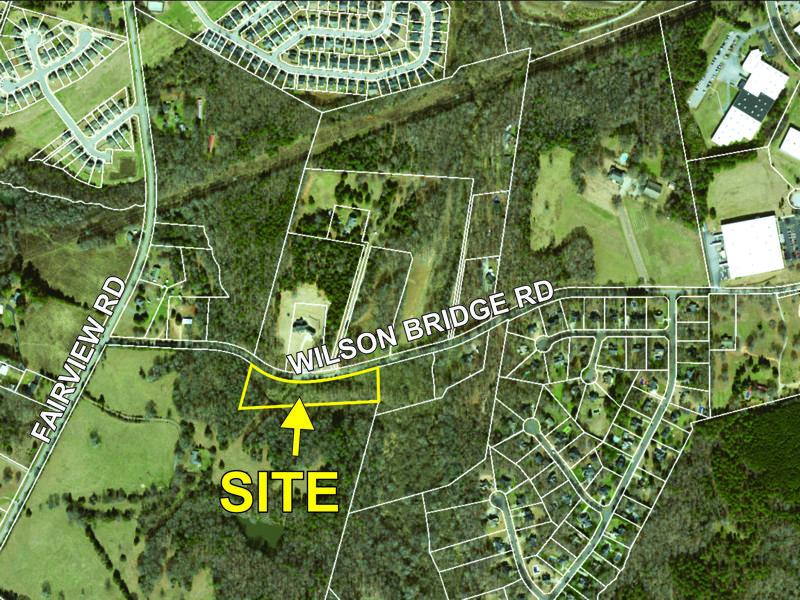
- • 3.7+- acre parcel on Wilson Bridge Rd.
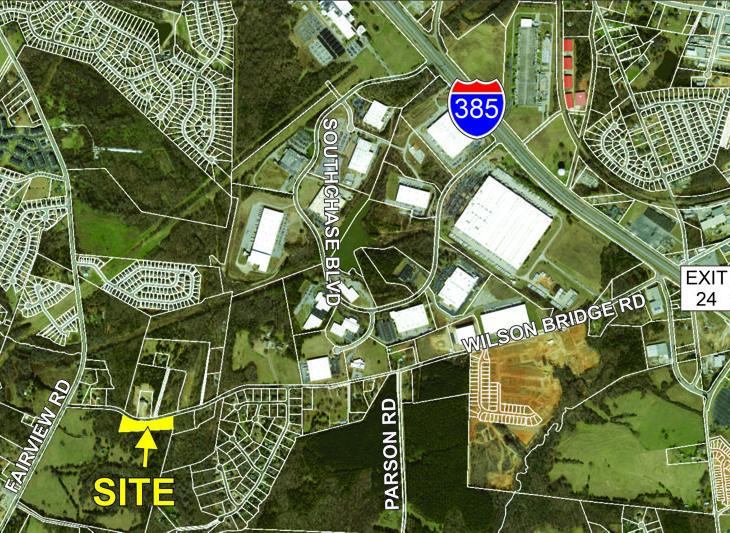
- • 2.3+- miles from I-385 (Exit 24)
- • Public water and natural gas available
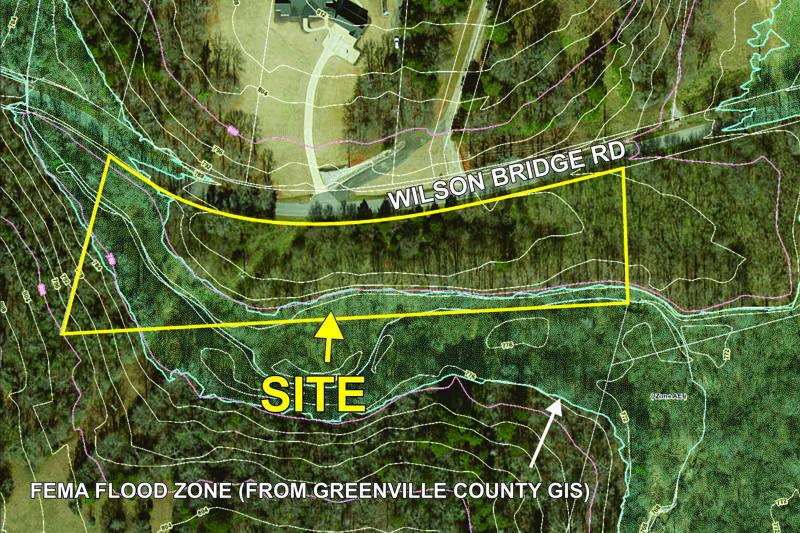
- • Property does not perc for septic tank
Listing Agents

Michael Wood
O: 864-848-9070
M: 864-325-1501
mwood@langston-black.com
O: 864-848-9070
M: 864-325-1501
mwood@langston-black.com
While we strive to provide the most accurate information, all listing information, and demographic data, is provided by third-parties. As such, MyEListing will not be responsible for the accuracy of the information. It is strongly recommended that you verify all information with the listing agent, and any relevant agencies, prior to making any decisions.