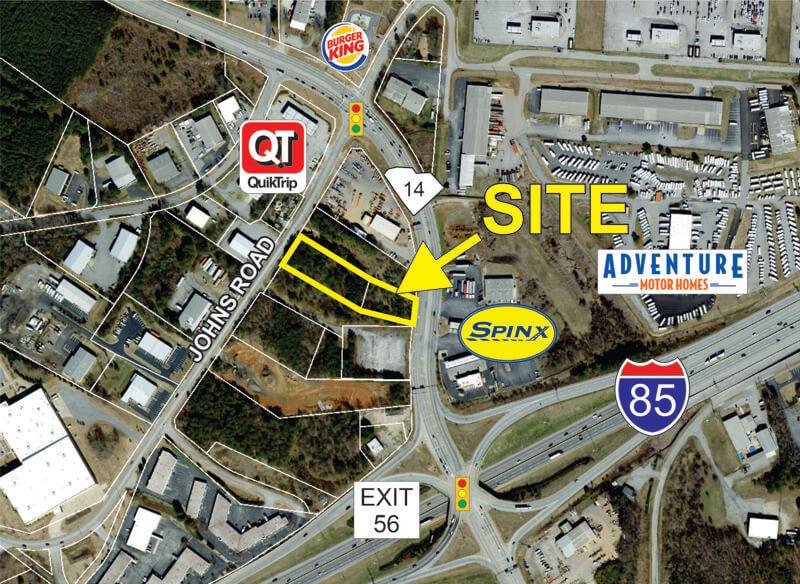
1-Mile | 3-Miles | 5-Miles | ||
---|---|---|---|---|
Total Population | 1,816 | 27,139 | 95,535 | |
Population Median Age | 38 | 39 | 38 | |
Population by Age | 0-9 Yrs | 255 (14%) | 3447 (12%) | 12674 (13%) |
10-19 Yrs | 257 (14%) | 4304 (15%) | 14210 (14%) | |
20-29 Yrs | 179 (9%) | 2501 (9%) | 9941 (10%) | |
30-39 Yrs | 193 (10%) | 2797 (10%) | 12357 (12%) | |
40-49 Yrs | 307 (16%) | 4291 (15%) | 14072 (14%) | |
50-59 Yrs | 238 (13%) | 3690 (13%) | 12380 (12%) | |
60-69 Yrs | 220 (12%) | 3339 (12%) | 10374 (10%) | |
70+ Yrs | 166 (9%) | 2769 (10%) | 9526 (9%) | |
Median HH Income | $79,957 | $89,542 | $78,249 | |
Total Household Income | < 24K | 38 (6%) | 744 (7%) | 4621 (12%) |
25-49K | 60 (9%) | 1494 (15%) | 6633 (18%) | |
50-74K | 196 (31%) | 1876 (18%) | 5937 (16%) | |
75-99K | 91 (14%) | 1448 (14%) | 5242 (14%) | |
100-199K | 179 (28%) | 3103 (31%) | 9555 (26%) | |
200K+ | 61 (9%) | 1248 (12%) | 3756 (10%) | |
Highest Education Level | No Diploma | 100 | 1044 | 4500 |
Diploma or GED | 204 | 2506 | 11606 | |
Some College | 226 | 3021 | 11737 | |
Assoc. Degree | 104 | 1787 | 6038 | |
Bachelors Degree | 317 | 6110 | 19424 | |
Higher Degree | 275 | 3850 | 11187 | |
Total Housing Units | 650 | 10,669 | 38,478 | |
--Owner-Occupied | 563 | 7,548 | 25,570 | |
--Renter-Occupied | 62 | 2,365 | 10,174 | |
Owner-Occupied Values | < 100K | 21 | 318 | 2166 |
100-199K | 178 | 1968 | 7522 | |
200-299K | 203 | 1979 | 6602 | |
300-399K | 87 | 1401 | 4176 | |
400-499K | 46 | 677 | 2273 | |
500K+ | 28 | 1206 | 2831 | |
Total Working Age Population | 1,376 | 20,994 | 73,803 | |
In Work Force | 886 | 13,895 | 48,779 | |
Not In Work Force | 491 | 7,099 | 25,024 | |
Workforce Employed | 868 | 13,430 | 46,956 | |
Workforce Unemployed | 17 | 449 | 1,758 | |
Civlian Workforce | 885 | 13,879 | 48,714 | |
Military Workforce | 0 | 15 | 66 | |
Total Households | 625 | 9,913 | 35,744 | |
Family Households | 500 | 7,368 | 25,478 | |
Non-Family Households | 125 | 2,546 | 10,266 | |
Married Couple | 440 | 6,192 | 20,612 | |
Other Family | 60 | 1,175 | 4,866 | |
Married w/Child | 232 | 2,969 | 9,987 | |
Single Male w/Child | 2 | 316 | 1,019 | |
Single Female w/Child | 22 | 419 | 1,762 |
Population Change Last Two Decades - Plus Projection
2000 | % | 2010 | % | 2020 | % | 2030 | |
---|---|---|---|---|---|---|---|
South Carolina | 4,012,012 | +15 | 4,625,364 | +9 | 5,020,400 | +9 | 5,488,460 |
Spartanburg County | 253,791 | +12 | 284,307 | +9 | 310,220 | +9 | 336,810 |
Greenville County | 379,616 | +19 | 451,225 | +9 | 492,890 | +10 | 542,290 |
Total Working Age Population:
Total Households:
Total Working Age Population:
Total Households:
Total Working Age Population:
Total Households: