Commercial Land
Splawn Town Boiling Springs, SC 29316
Splawn Town Boiling Springs, SC 29316
Details & Description
Property Highlights
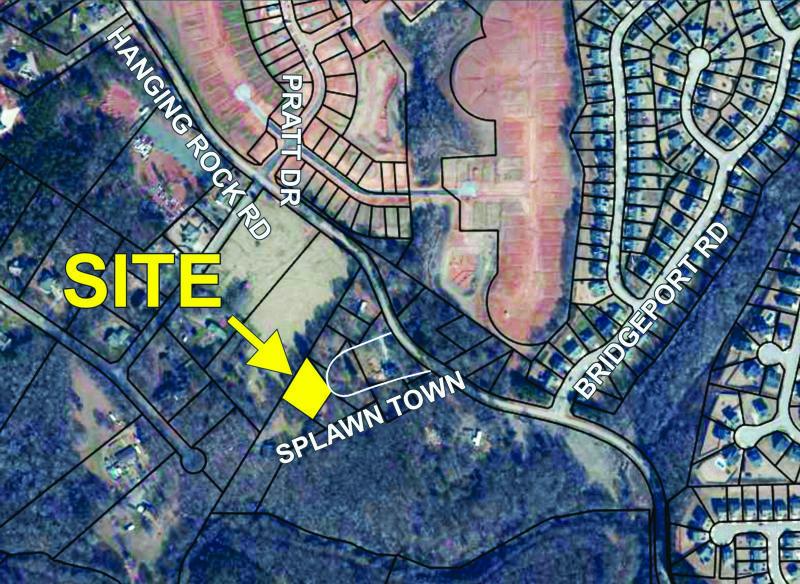
- • 0.6+- acre parcel on Splawn Town
- • Just off of Hanging Rock Rd
- • An area that has seen lots of residential growth
- • 2+- miles from Boiling Springs Rd (Hwy 9)
- • Public water available
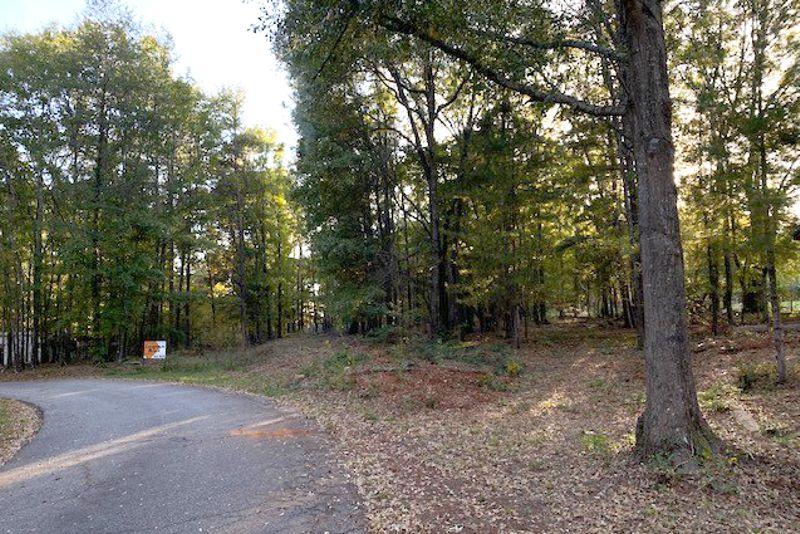
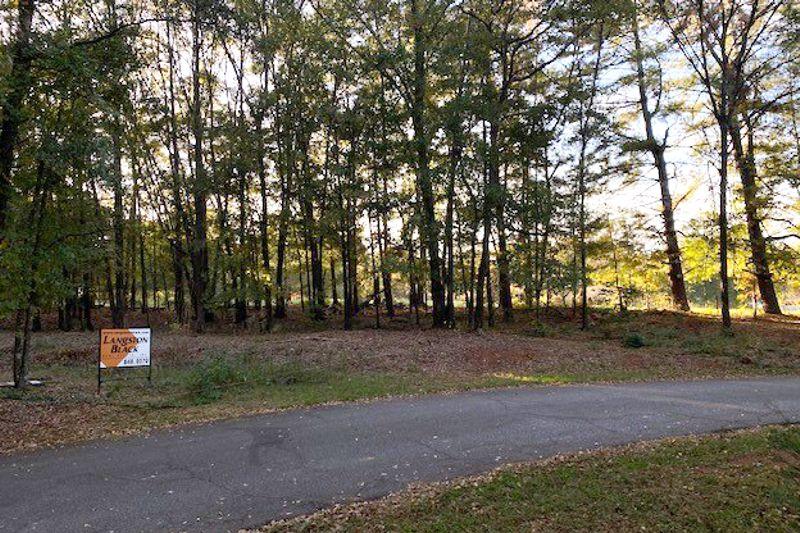
Additional Photos

Listing Agents

Glenn Young
O: 864-848-9070
M: 864-384-4999
gyoung@langston-black.com
O: 864-848-9070
M: 864-384-4999
gyoung@langston-black.com
While we strive to provide the most accurate information, all listing information, and demographic data, is provided by third-parties. As such, MyEListing will not be responsible for the accuracy of the information. It is strongly recommended that you verify all information with the listing agent, and any relevant agencies, prior to making any decisions.


