Commercial Land
Saxon Ave Spartanburg, SC 29301
Saxon Ave Spartanburg, SC 29301
Details & Description
Property Highlights
- • Development Land For Sale
- • Multi-family allows approx 8 units per acre
- • All Utilities Available
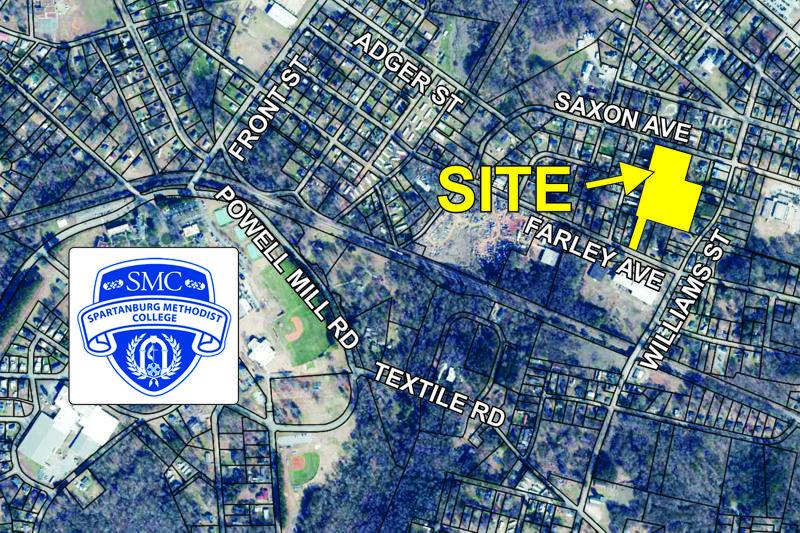
- • Access to Farley Ave
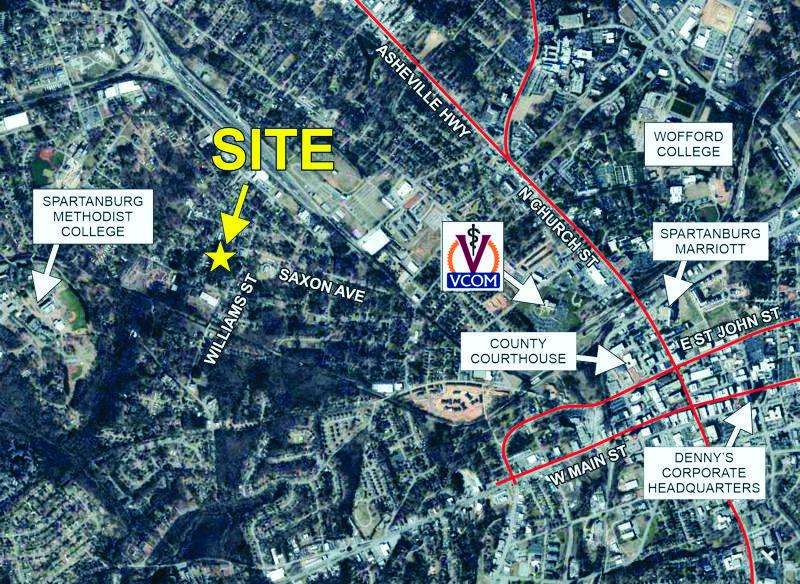
- • 1+- mile from Spartanburg Methodist College
- • 2+- miles from downtown Spartanburg
Additional Photos


Listing Agents

Chuck Langston
O: 864-848-9070
M: 864-230-4302
clangston@langston-black.com
O: 864-848-9070
M: 864-230-4302
clangston@langston-black.com
While we strive to provide the most accurate information, all listing information, and demographic data, is provided by third-parties. As such, MyEListing will not be responsible for the accuracy of the information. It is strongly recommended that you verify all information with the listing agent, and any relevant agencies, prior to making any decisions.


