Commercial Land
5208 Wade Hampton Boulevard Taylors, SC 29687
5208 Wade Hampton Boulevard Taylors, SC 29687
Details & Description
Property Highlights
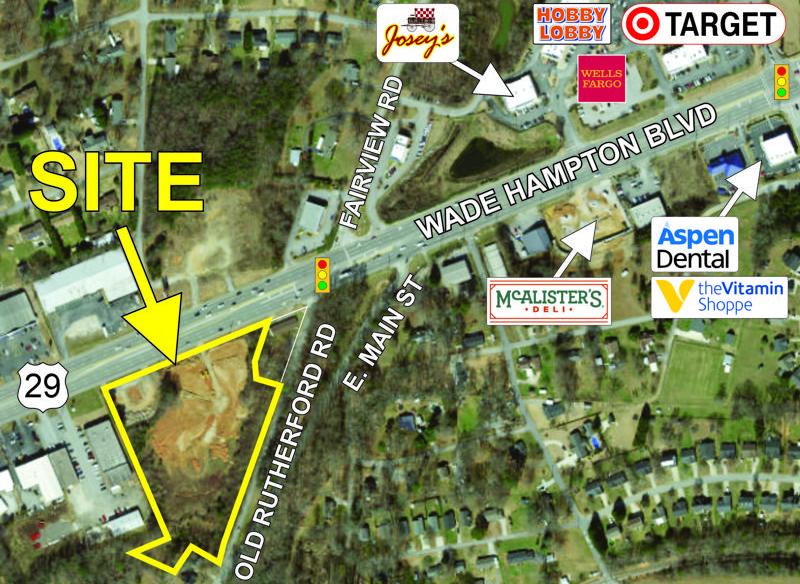
- • 560'+- frontage on Hwy 29
- • Property has been rough graded
- • Detention pond in place
- • All utilities available
Listing Agents

Chuck Langston
O: 864-848-9070
M: 864-230-4302
clangston@langston-black.com
O: 864-848-9070
M: 864-230-4302
clangston@langston-black.com
While we strive to provide the most accurate information, all listing information, and demographic data, is provided by third-parties. As such, MyEListing will not be responsible for the accuracy of the information. It is strongly recommended that you verify all information with the listing agent, and any relevant agencies, prior to making any decisions.


