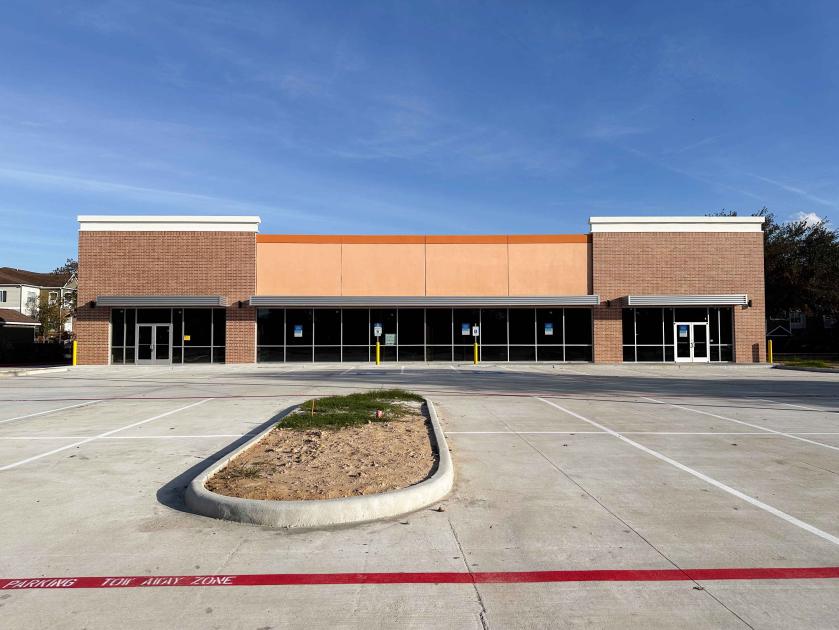
Retail Space
10760 Barker Cypress Road Cypress, TX 77433
10760 Barker Cypress Road Cypress, TX 77433
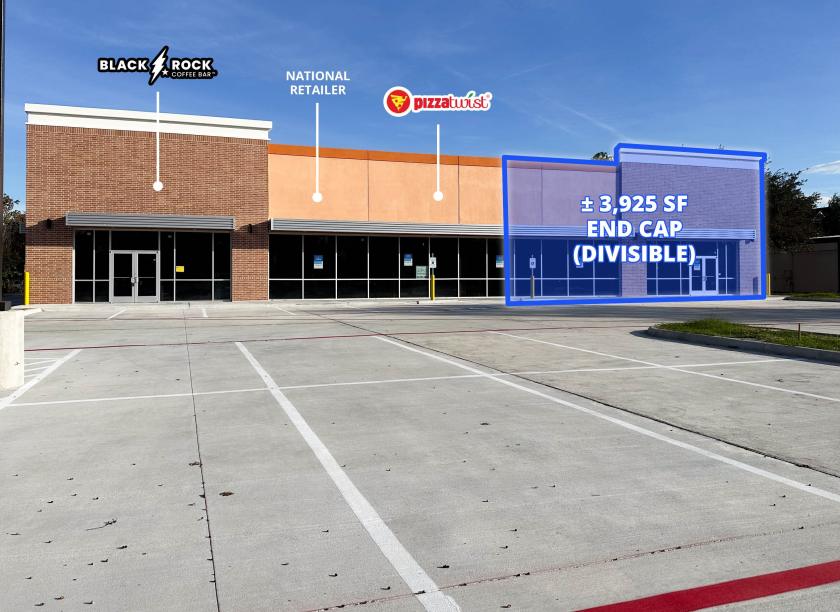
Details & Description
Property Highlights
• Surrounded by affluent neighborhoods of Towne Lake, Adler Trails, Riata Ranch & West, Canyon Lakes, and the Bridgel
• Less than two miles south of Highway 290, and just one mile north of Boardwalk Towne Lake Center and Kroger Marketplace
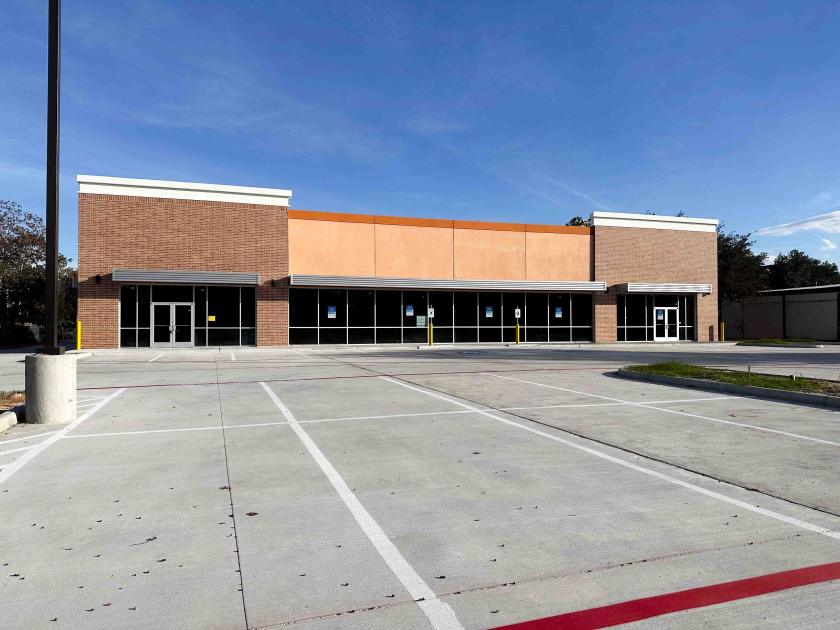
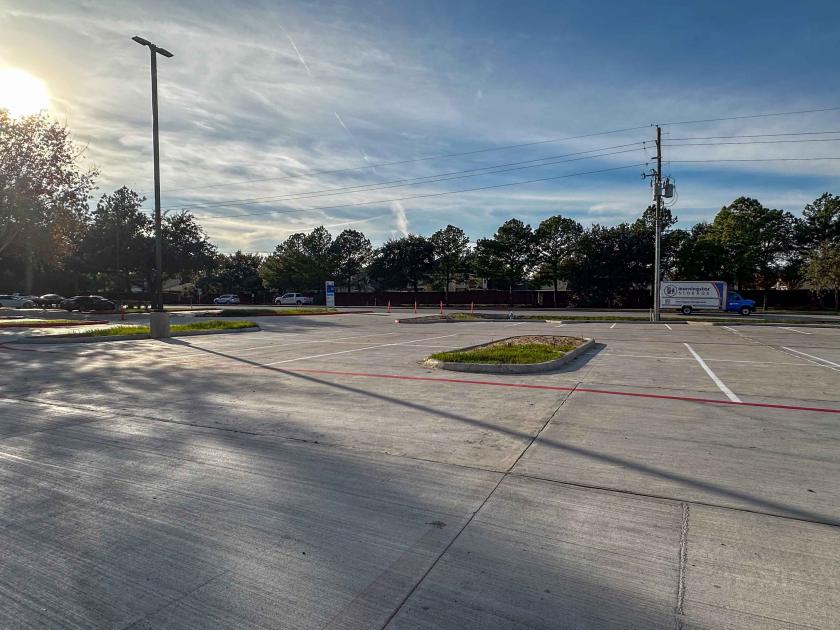
Additional Photos


Listing Agents

Kimberly Lenardson
O: 713-830-2186
M: 832-971-4885
kimberly.lenardson@colliers.com
O: 713-830-2186
M: 832-971-4885
kimberly.lenardson@colliers.com
While we strive to provide the most accurate information, all listing information, and demographic data, is provided by third-parties. As such, MyEListing will not be responsible for the accuracy of the information. It is strongly recommended that you verify all information with the listing agent, and any relevant agencies, prior to making any decisions.