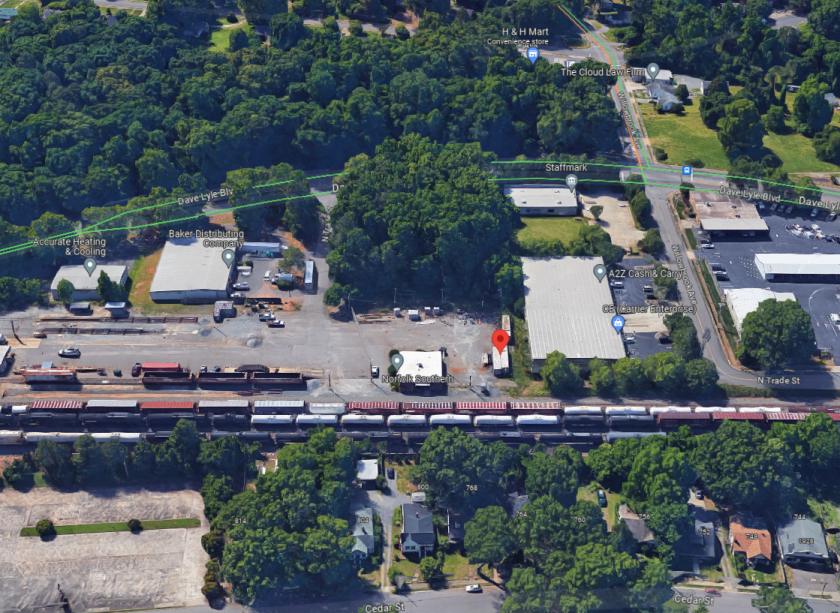
1-Mile | 3-Miles | 5-Miles | ||
---|---|---|---|---|
Total Population | 9,433 | 52,191 | 90,014 | |
Population Median Age | 34 | 36 | 38 | |
Population by Age | 0-9 Yrs | 859 (9%) | 6172 (11%) | 10857 (12%) |
10-19 Yrs | 1858 (19%) | 7937 (15%) | 12812 (14%) | |
20-29 Yrs | 2322 (24%) | 9208 (17%) | 13737 (15%) | |
30-39 Yrs | 913 (9%) | 7339 (14%) | 11947 (13%) | |
40-49 Yrs | 966 (10%) | 5716 (10%) | 10809 (12%) | |
50-59 Yrs | 1174 (12%) | 5865 (11%) | 10877 (12%) | |
60-69 Yrs | 804 (8%) | 5185 (9%) | 10289 (11%) | |
70+ Yrs | 535 (5%) | 4769 (9%) | 8684 (9%) | |
Median HH Income | $32,278 | $46,046 | $54,637 | |
Total Household Income | < 24K | 1346 (39%) | 5136 (24%) | 7254 (20%) |
25-49K | 927 (26%) | 5992 (29%) | 9085 (25%) | |
50-74K | 536 (15%) | 4140 (20%) | 6883 (19%) | |
75-99K | 320 (9%) | 2016 (9%) | 4069 (11%) | |
100-199K | 284 (8%) | 2764 (13%) | 7017 (19%) | |
200K+ | 27 (0%) | 506 (2%) | 1434 (4%) | |
Highest Education Level | No Diploma | 867 | 4107 | 6078 |
Diploma or GED | 1473 | 8867 | 14339 | |
Some College | 1316 | 8345 | 14911 | |
Assoc. Degree | 368 | 2832 | 5687 | |
Bachelors Degree | 708 | 5802 | 11828 | |
Higher Degree | 483 | 3260 | 6534 | |
Total Housing Units | 3,929 | 22,028 | 38,102 | |
--Owner-Occupied | 1,110 | 10,025 | 20,372 | |
--Renter-Occupied | 2,329 | 10,528 | 15,369 | |
Owner-Occupied Values | < 100K | 375 | 2817 | 3812 |
100-199K | 419 | 4311 | 8122 | |
200-299K | 102 | 1994 | 4715 | |
300-399K | 199 | 669 | 2515 | |
400-499K | 3 | 93 | 526 | |
500K+ | 11 | 141 | 682 | |
Total Working Age Population | 8,063 | 41,892 | 71,996 | |
In Work Force | 4,907 | 28,052 | 47,846 | |
Not In Work Force | 3,156 | 13,840 | 24,151 | |
Workforce Employed | 4,164 | 25,738 | 44,731 | |
Workforce Unemployed | 737 | 2,047 | 2,763 | |
Civlian Workforce | 4,901 | 27,785 | 47,494 | |
Military Workforce | 6 | 267 | 352 | |
Total Households | 3,439 | 20,553 | 35,741 | |
Family Households | 1,684 | 11,428 | 21,442 | |
Non-Family Households | 1,755 | 9,126 | 14,299 | |
Married Couple | 833 | 6,610 | 14,332 | |
Other Family | 851 | 4,817 | 7,110 | |
Married w/Child | 224 | 2,433 | 5,297 | |
Single Male w/Child | 123 | 468 | 724 | |
Single Female w/Child | 276 | 1,997 | 3,010 |
Population Change Last Two Decades - Plus Projection
2000 | % | 2010 | % | 2020 | % | 2030 | |
---|---|---|---|---|---|---|---|
South Carolina | 4,012,012 | +15 | 4,625,364 | +9 | 5,020,400 | +9 | 5,488,460 |
York County | 164,614 | +37 | 226,073 | +12 | 252,860 | +14 | 287,970 |
Total Working Age Population:
Total Households:
Total Working Age Population:
Total Households:
Total Working Age Population:
Total Households: