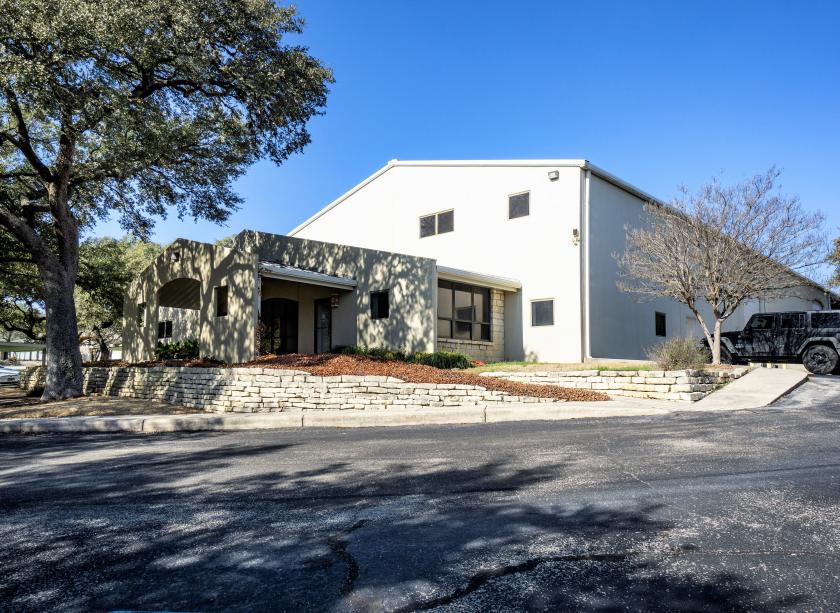
Office Space
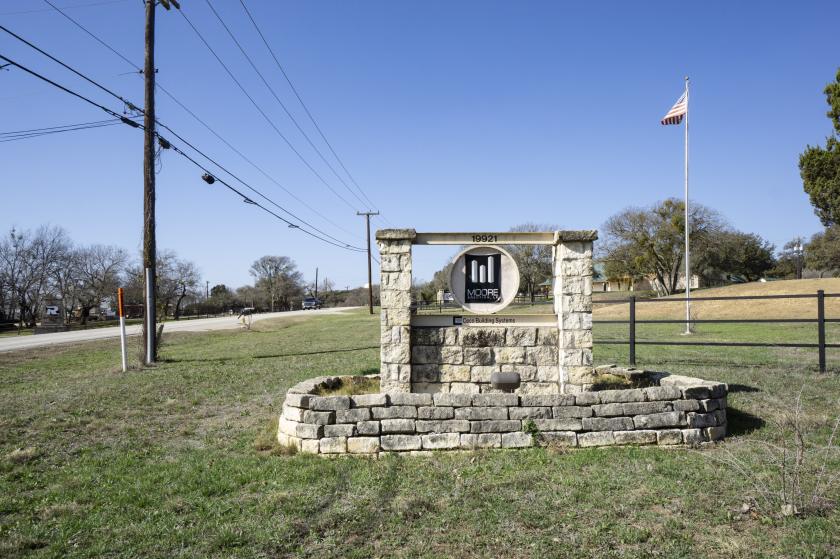
19921 Farm to Market Road 2252 Garden Ridge, TX 78266
19921 Farm to Market Road 2252 Garden Ridge, TX 78266
Details & Description
Property Highlights
- • TOTAL BUILDING SIZE: 12,000 sf
- • AVAILABILITY: 1,300 sf
- • RENTAL RATE: $24.00 / sf
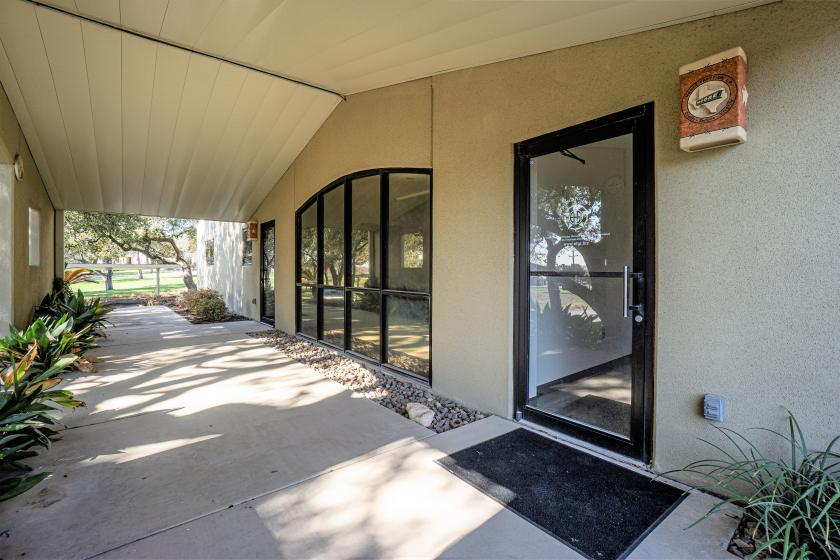
- • PARKING: Covered parking available
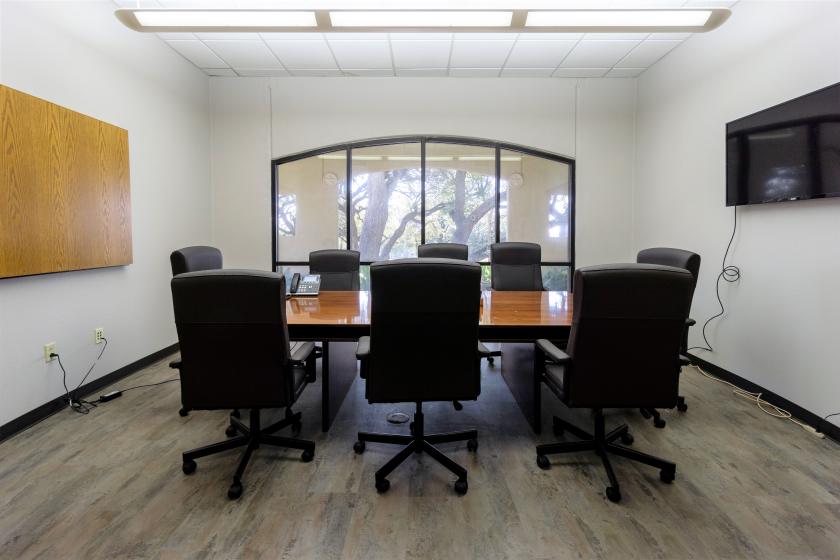
Additional Photos

Listing Agents

Marcus Andrade
O: 210-366-2222
M: 210-878-6722
mandrade@endurasa.com
O: 210-366-2222
M: 210-878-6722
mandrade@endurasa.com
While we strive to provide the most accurate information, all listing information, and demographic data, is provided by third-parties. As such, MyEListing will not be responsible for the accuracy of the information. It is strongly recommended that you verify all information with the listing agent, and any relevant agencies, prior to making any decisions.


