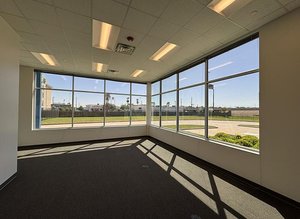
1-Mile | 3-Miles | 5-Miles | ||
---|---|---|---|---|
Total Population | 16,198 | 109,657 | 286,664 | |
Population Median Age | 32 | 34 | 34 | |
Population by Age | 0-9 Yrs | 2446 (15%) | 17277 (15%) | 44729 (15%) |
10-19 Yrs | 2533 (15%) | 16530 (15%) | 45072 (15%) | |
20-29 Yrs | 3161 (19%) | 17645 (16%) | 42214 (14%) | |
30-39 Yrs | 2606 (16%) | 17205 (15%) | 44720 (15%) | |
40-49 Yrs | 1487 (9%) | 13535 (12%) | 36988 (12%) | |
50-59 Yrs | 2133 (13%) | 12489 (11%) | 32793 (11%) | |
60-69 Yrs | 1125 (6%) | 8663 (7%) | 23965 (8%) | |
70+ Yrs | 707 (4%) | 6312 (5%) | 16184 (5%) | |
Median HH Income | $39,554 | $54,858 | $59,895 | |
Total Household Income | < 24K | 1895 (26%) | 7480 (18%) | 16916 (17%) |
25-49K | 2501 (34%) | 10632 (26%) | 23453 (24%) | |
50-74K | 1632 (22%) | 7381 (18%) | 18141 (18%) | |
75-99K | 410 (5%) | 4145 (10%) | 11787 (12%) | |
100-199K | 667 (9%) | 7558 (19%) | 20577 (21%) | |
200K+ | 82 (1%) | 2338 (5%) | 5741 (5%) | |
Highest Education Level | No Diploma | 915 | 8375 | 26120 |
Diploma or GED | 3154 | 16592 | 43730 | |
Some College | 2733 | 17753 | 44096 | |
Assoc. Degree | 918 | 6237 | 16938 | |
Bachelors Degree | 1163 | 12481 | 31965 | |
Higher Degree | 982 | 5650 | 13922 | |
Total Housing Units | 8,335 | 43,646 | 105,091 | |
--Owner-Occupied | 1,546 | 18,244 | 53,441 | |
--Renter-Occupied | 5,642 | 21,289 | 43,174 | |
Owner-Occupied Values | < 100K | 259 | 1116 | 5241 |
100-199K | 990 | 10165 | 29134 | |
200-299K | 292 | 5186 | 13689 | |
300-399K | 5 | 1073 | 3529 | |
400-499K | 0 | 432 | 1076 | |
500K+ | 0 | 272 | 772 | |
Total Working Age Population | 12,180 | 82,588 | 214,638 | |
In Work Force | 9,251 | 58,453 | 148,190 | |
Not In Work Force | 2,929 | 24,135 | 66,449 | |
Workforce Employed | 8,467 | 55,134 | 139,345 | |
Workforce Unemployed | 784 | 3,299 | 8,702 | |
Civlian Workforce | 9,251 | 58,433 | 148,046 | |
Military Workforce | 0 | 20 | 144 | |
Total Households | 7,187 | 39,533 | 96,616 | |
Family Households | 3,344 | 25,252 | 67,894 | |
Non-Family Households | 3,843 | 14,281 | 28,722 | |
Married Couple | 1,390 | 15,823 | 45,260 | |
Other Family | 1,955 | 9,429 | 22,634 | |
Married w/Child | 626 | 7,048 | 21,149 | |
Single Male w/Child | 184 | 1,147 | 2,590 | |
Single Female w/Child | 1,202 | 4,771 | 10,526 |
Population Change Last Two Decades - Plus Projection
2000 | % | 2010 | % | 2020 | % | 2030 | |
---|---|---|---|---|---|---|---|
Texas | 20,851,820 | +21 | 25,145,561 | +18 | 29,677,668 | +18 | 34,894,452 |
Harris County | 3,400,578 | +20 | 4,092,459 | +22 | 4,978,845 | +19 | 5,924,750 |
Total Working Age Population:
Total Households:
Total Working Age Population:
Total Households:
Total Working Age Population:
Total Households: