Retail Space
300 - 304 Grapevine Hwy Hurst, TX 76054
300 - 304 Grapevine Hwy Hurst, TX 76054
Details & Description
Property Highlights
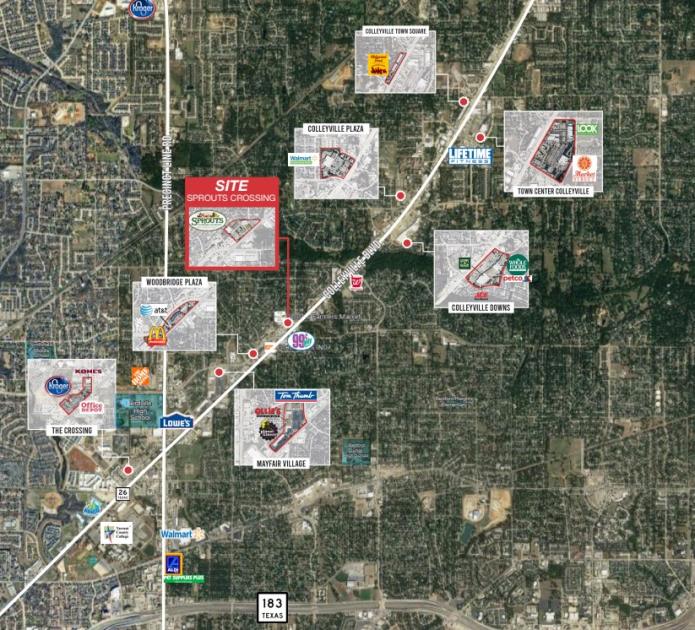
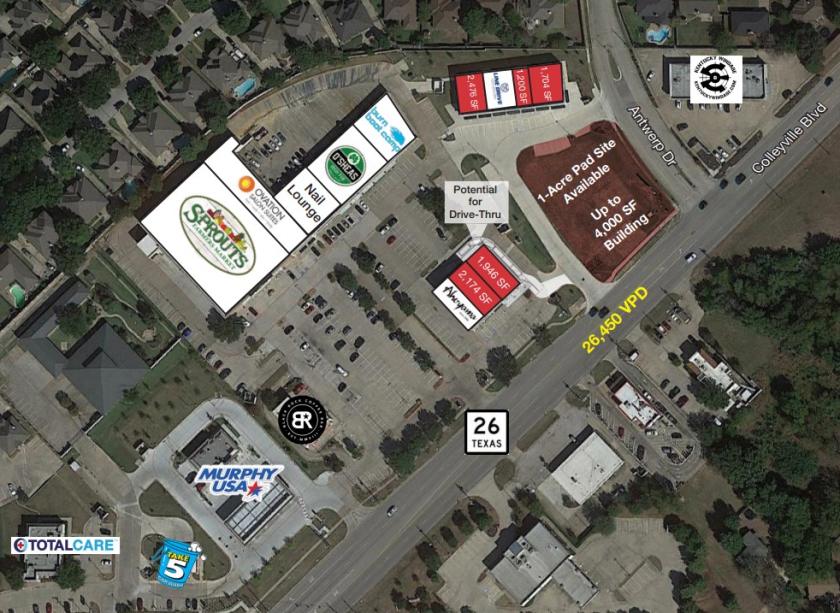
• High Growth Area with Easy Access to Highway 26, Highway 183 & Loop 820
• Future Signalized Intersection at Antwerp Dr. & Highway 26
Listing Agents

Hunter Hayes
O: 817-872-3911
M: 817-487-7200
hhayes@nairl.com
O: 817-872-3911
M: 817-487-7200
hhayes@nairl.com
Jake Blankenship
O: 817-872-3904
M: 512-415-4299
jblankenship@nairl.com
O: 817-872-3904
M: 512-415-4299
jblankenship@nairl.com
While we strive to provide the most accurate information, all listing information, and demographic data, is provided by third-parties. As such, MyEListing will not be responsible for the accuracy of the information. It is strongly recommended that you verify all information with the listing agent, and any relevant agencies, prior to making any decisions.