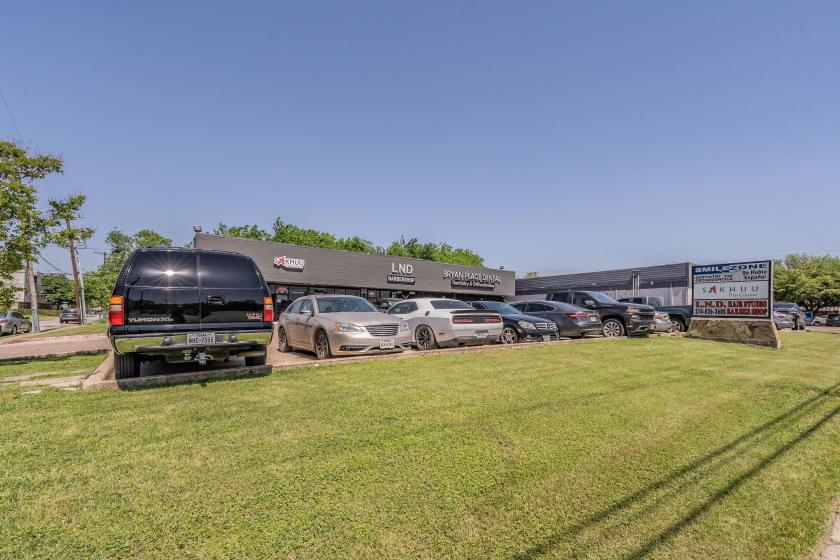
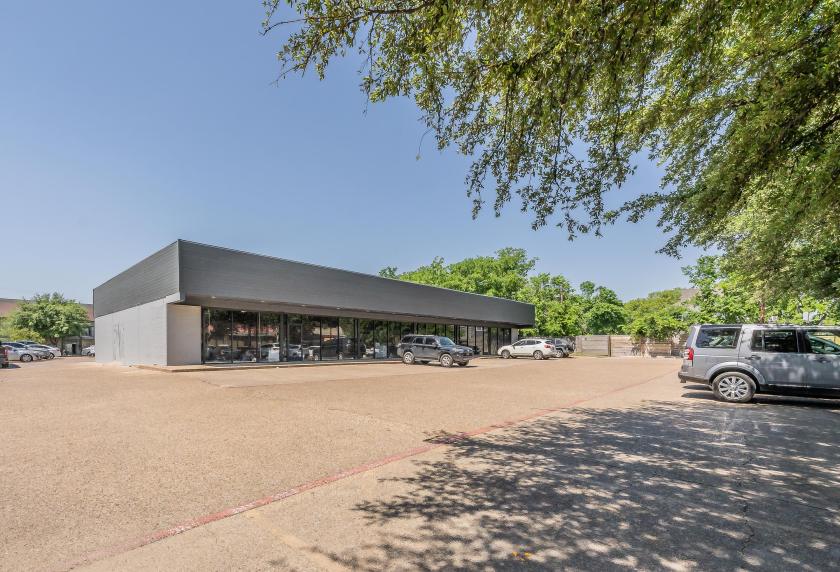
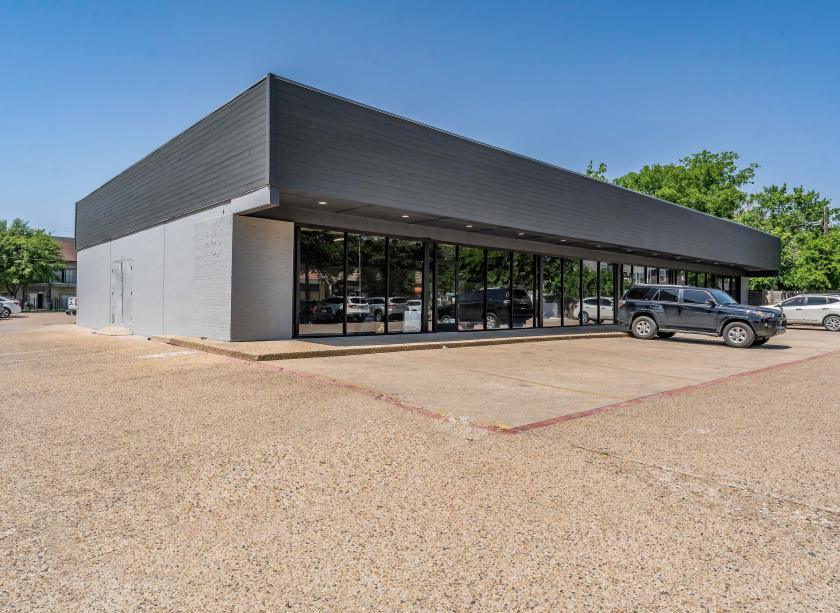
1-Mile | 3-Miles | 5-Miles | ||
---|---|---|---|---|
Total Population | 30,194 | 178,900 | 381,497 | |
Population Median Age | 34 | 36 | 36 | |
Population by Age | 0-9 Yrs | 2663 (8%) | 15436 (8%) | 40976 (10%) |
10-19 Yrs | 2505 (8%) | 13139 (7%) | 37513 (9%) | |
20-29 Yrs | 8167 (27%) | 46372 (25%) | 82397 (21%) | |
30-39 Yrs | 7551 (25%) | 38588 (21%) | 71459 (18%) | |
40-49 Yrs | 3297 (10%) | 22039 (12%) | 47802 (12%) | |
50-59 Yrs | 2830 (9%) | 19952 (11%) | 44227 (11%) | |
60-69 Yrs | 2081 (6%) | 14076 (7%) | 33680 (8%) | |
70+ Yrs | 1101 (3%) | 9298 (5%) | 23444 (6%) | |
Median HH Income | $61,862 | $81,167 | $70,224 | |
Total Household Income | < 24K | 3179 (21%) | 13965 (15%) | 30630 (17%) |
25-49K | 2751 (18%) | 12890 (14%) | 31327 (18%) | |
50-74K | 2823 (19%) | 15836 (17%) | 30044 (17%) | |
75-99K | 1990 (13%) | 11002 (12%) | 20365 (11%) | |
100-199K | 2655 (17%) | 22274 (24%) | 35776 (20%) | |
200K+ | 1418 (9%) | 14843 (16%) | 25503 (14%) | |
Highest Education Level | No Diploma | 3536 | 13355 | 37236 |
Diploma or GED | 3094 | 13461 | 39275 | |
Some College | 4080 | 18920 | 40626 | |
Assoc. Degree | 1101 | 5587 | 11448 | |
Bachelors Degree | 7221 | 50511 | 85564 | |
Higher Degree | 3461 | 32204 | 57115 | |
Total Housing Units | 17,370 | 103,824 | 196,796 | |
--Owner-Occupied | 3,311 | 28,704 | 63,491 | |
--Renter-Occupied | 11,505 | 62,106 | 110,154 | |
Owner-Occupied Values | < 100K | 39 | 2019 | 6840 |
100-199K | 308 | 3395 | 10345 | |
200-299K | 358 | 3261 | 8205 | |
300-399K | 848 | 3976 | 7599 | |
400-499K | 786 | 4095 | 6260 | |
500K+ | 971 | 11957 | 24242 | |
Total Working Age Population | 25,883 | 155,971 | 316,856 | |
In Work Force | 20,868 | 120,314 | 229,198 | |
Not In Work Force | 5,015 | 35,656 | 87,658 | |
Workforce Employed | 19,597 | 115,451 | 218,398 | |
Workforce Unemployed | 1,249 | 4,759 | 10,663 | |
Civlian Workforce | 20,846 | 120,209 | 229,062 | |
Military Workforce | 22 | 105 | 136 | |
Total Households | 14,816 | 90,809 | 173,646 | |
Family Households | 5,396 | 33,067 | 77,693 | |
Non-Family Households | 9,420 | 57,743 | 95,953 | |
Married Couple | 3,569 | 25,181 | 56,509 | |
Other Family | 1,827 | 7,886 | 21,183 | |
Married w/Child | 1,233 | 8,523 | 22,622 | |
Single Male w/Child | 212 | 791 | 2,038 | |
Single Female w/Child | 833 | 3,149 | 8,197 |
Population Change Last Two Decades - Plus Projection
2000 | % | 2010 | % | 2020 | % | 2030 | |
---|---|---|---|---|---|---|---|
Texas | 20,851,820 | +21 | 25,145,561 | +18 | 29,677,668 | +18 | 34,894,452 |
Dallas County | 2,218,899 | +7 | 2,368,139 | +15 | 2,734,111 | +14 | 3,106,298 |
Total Working Age Population:
Total Households:
Total Working Age Population:
Total Households:
Total Working Age Population:
Total Households: