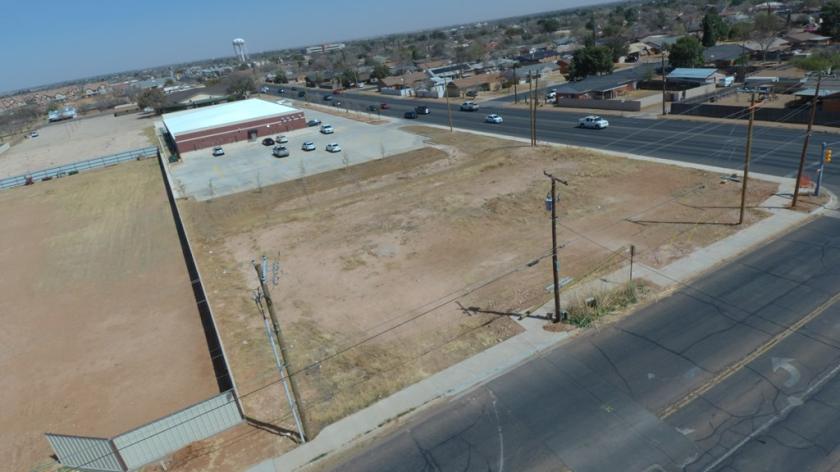
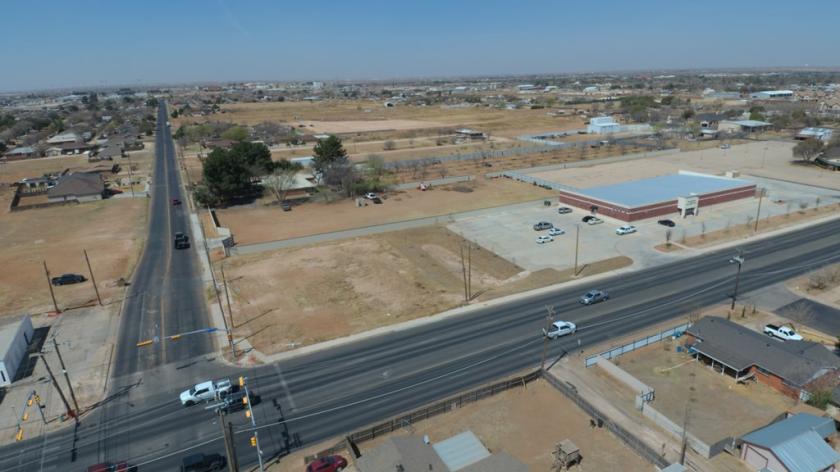
1-Mile | 3-Miles | 5-Miles | ||
---|---|---|---|---|
Total Population | 15,693 | 80,795 | 133,307 | |
Population Median Age | 33 | 34 | 34 | |
Population by Age | 0-9 Yrs | 2438 (15%) | 12717 (15%) | 22149 (16%) |
10-19 Yrs | 2344 (14%) | 11044 (13%) | 18123 (13%) | |
20-29 Yrs | 2853 (18%) | 13490 (16%) | 22118 (16%) | |
30-39 Yrs | 1989 (12%) | 12327 (15%) | 20806 (15%) | |
40-49 Yrs | 2706 (17%) | 10004 (12%) | 15429 (11%) | |
50-59 Yrs | 1274 (8%) | 8563 (10%) | 14436 (10%) | |
60-69 Yrs | 1046 (6%) | 6843 (8%) | 10968 (8%) | |
70+ Yrs | 1042 (6%) | 5806 (7%) | 9277 (6%) | |
Median HH Income | $78,534 | $87,196 | $81,214 | |
Total Household Income | < 24K | 752 (13%) | 3107 (11%) | 6098 (13%) |
25-49K | 1035 (18%) | 4164 (15%) | 7538 (16%) | |
50-74K | 874 (15%) | 4351 (15%) | 7276 (16%) | |
75-99K | 654 (11%) | 4242 (15%) | 6083 (13%) | |
100-199K | 1509 (27%) | 8224 (30%) | 12493 (27%) | |
200K+ | 683 (12%) | 3295 (12%) | 5361 (11%) | |
Highest Education Level | No Diploma | 1867 | 6620 | 14191 |
Diploma or GED | 2592 | 13530 | 21578 | |
Some College | 2197 | 11197 | 17996 | |
Assoc. Degree | 936 | 4461 | 6607 | |
Bachelors Degree | 1291 | 11544 | 17189 | |
Higher Degree | 533 | 3951 | 6207 | |
Total Housing Units | 6,111 | 29,222 | 48,264 | |
--Owner-Occupied | 3,067 | 17,498 | 28,933 | |
--Renter-Occupied | 2,440 | 9,885 | 15,917 | |
Owner-Occupied Values | < 100K | 312 | 1538 | 4288 |
100-199K | 1600 | 5240 | 7904 | |
200-299K | 977 | 6045 | 8257 | |
300-399K | 114 | 2475 | 4108 | |
400-499K | 21 | 923 | 1664 | |
500K+ | 43 | 1276 | 2712 | |
Total Working Age Population | 11,961 | 60,808 | 99,347 | |
In Work Force | 8,890 | 42,847 | 69,500 | |
Not In Work Force | 3,071 | 17,961 | 29,847 | |
Workforce Employed | 8,769 | 41,615 | 67,251 | |
Workforce Unemployed | 121 | 1,215 | 2,214 | |
Civlian Workforce | 8,890 | 42,830 | 69,465 | |
Military Workforce | 0 | 17 | 35 | |
Total Households | 5,507 | 27,383 | 44,850 | |
Family Households | 3,724 | 18,846 | 30,529 | |
Non-Family Households | 1,784 | 8,537 | 14,320 | |
Married Couple | 2,347 | 14,152 | 22,277 | |
Other Family | 1,376 | 4,694 | 8,252 | |
Married w/Child | 1,200 | 6,783 | 11,050 | |
Single Male w/Child | 617 | 1,133 | 1,620 | |
Single Female w/Child | 312 | 1,787 | 3,275 |
Population Change Last Two Decades - Plus Projection
2000 | % | 2010 | % | 2020 | % | 2030 | |
---|---|---|---|---|---|---|---|
Texas | 20,851,820 | +21 | 25,145,561 | +18 | 29,677,668 | +18 | 34,894,452 |
Midland County | 116,009 | +18 | 136,872 | +37 | 187,364 | +43 | 268,123 |
Total Working Age Population:
Total Households:
Total Working Age Population:
Total Households:
Total Working Age Population:
Total Households: