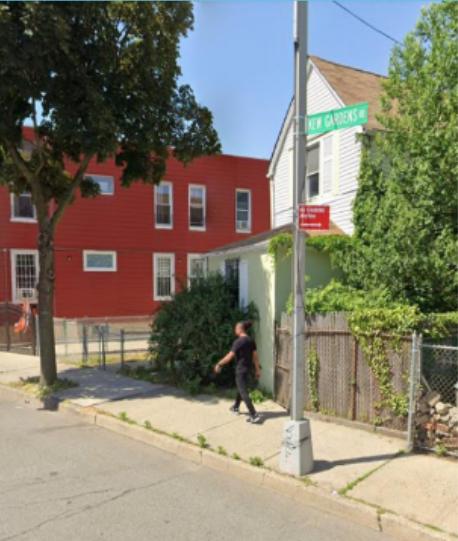
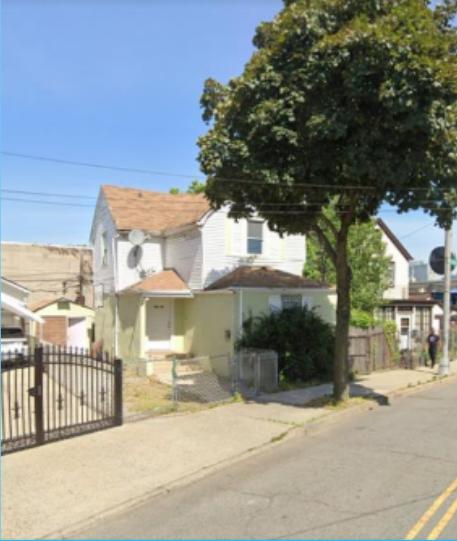
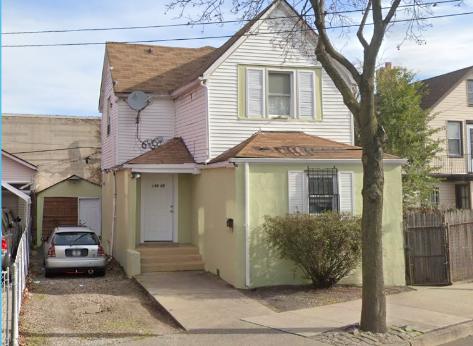
1-Mile | 3-Miles | 5-Miles | ||
---|---|---|---|---|
Total Population | 109,107 | 719,256 | 1,819,901 | |
Population Median Age | 38 | 39 | 39 | |
Population by Age | 0-9 Yrs | 13721 (12%) | 86020 (11%) | 214552 (11%) |
10-19 Yrs | 11595 (10%) | 80797 (11%) | 204669 (11%) | |
20-29 Yrs | 16795 (15%) | 102705 (14%) | 253198 (13%) | |
30-39 Yrs | 17118 (15%) | 99904 (13%) | 262570 (14%) | |
40-49 Yrs | 14629 (13%) | 91435 (12%) | 238756 (13%) | |
50-59 Yrs | 13919 (12%) | 100580 (13%) | 254507 (13%) | |
60-69 Yrs | 11784 (10%) | 83622 (11%) | 204168 (11%) | |
70+ Yrs | 9546 (8%) | 74193 (10%) | 187480 (10%) | |
Median HH Income | $70,858 | $74,840 | $67,891 | |
Total Household Income | < 24K | 6147 (17%) | 38567 (16%) | 115080 (18%) |
25-49K | 6507 (18%) | 42285 (17%) | 117529 (19%) | |
50-74K | 6272 (17%) | 37656 (15%) | 98332 (16%) | |
75-99K | 4900 (13%) | 33318 (14%) | 82005 (13%) | |
100-199K | 9141 (25%) | 63363 (26%) | 148328 (24%) | |
200K+ | 2688 (7%) | 21358 (9%) | 45792 (7%) | |
Highest Education Level | No Diploma | 15564 | 86458 | 241498 |
Diploma or GED | 17653 | 132268 | 378191 | |
Some College | 12439 | 79137 | 192914 | |
Assoc. Degree | 5700 | 38675 | 101989 | |
Bachelors Degree | 15831 | 105550 | 238418 | |
Higher Degree | 9726 | 66564 | 138313 | |
Total Housing Units | 38,418 | 253,805 | 656,627 | |
--Owner-Occupied | 13,010 | 118,886 | 275,377 | |
--Renter-Occupied | 22,646 | 117,660 | 331,690 | |
Owner-Occupied Values | < 100K | 301 | 3974 | 8688 |
100-199K | 1307 | 6458 | 13139 | |
200-299K | 1886 | 9838 | 22985 | |
300-399K | 1148 | 13820 | 31624 | |
400-499K | 1551 | 18292 | 42045 | |
500K+ | 6817 | 66504 | 156896 | |
Total Working Age Population | 88,197 | 584,450 | 1,478,604 | |
In Work Force | 58,623 | 371,124 | 933,218 | |
Not In Work Force | 29,573 | 213,327 | 545,386 | |
Workforce Employed | 54,065 | 345,397 | 874,177 | |
Workforce Unemployed | 4,530 | 25,534 | 58,438 | |
Civlian Workforce | 58,595 | 370,931 | 932,614 | |
Military Workforce | 28 | 192 | 603 | |
Total Households | 35,655 | 236,546 | 607,066 | |
Family Households | 24,085 | 168,808 | 427,345 | |
Non-Family Households | 11,570 | 67,738 | 179,721 | |
Married Couple | 16,148 | 113,435 | 276,143 | |
Other Family | 7,937 | 55,372 | 151,202 | |
Married w/Child | 7,060 | 46,353 | 113,150 | |
Single Male w/Child | 535 | 3,786 | 11,298 | |
Single Female w/Child | 1,916 | 13,724 | 40,105 |
Population Change Last Two Decades - Plus Projection
2000 | % | 2010 | % | 2020 | % | 2030 | |
---|---|---|---|---|---|---|---|
New York | 18,976,457 | +2 | 19,378,102 | +4 | 20,146,131 | +2 | 20,604,030 |
Queens County | 2,229,379 | 0 | 2,230,722 | +9 | 2,436,549 | +5 | 2,565,268 |
Nassau County | 1,334,544 | 0 | 1,339,532 | +4 | 1,386,500 | +3 | 1,432,859 |
Kings County | 2,465,326 | +2 | 2,504,700 | +9 | 2,738,283 | +5 | 2,863,996 |
Total Working Age Population:
Total Households:
Total Working Age Population:
Total Households:
Total Working Age Population:
Total Households: