Commercial Land
13521 Old Highway 280 Meadowbrook, AL 35242
13521 Old Highway 280 Meadowbrook, AL 35242
Details & Description
Property Highlights
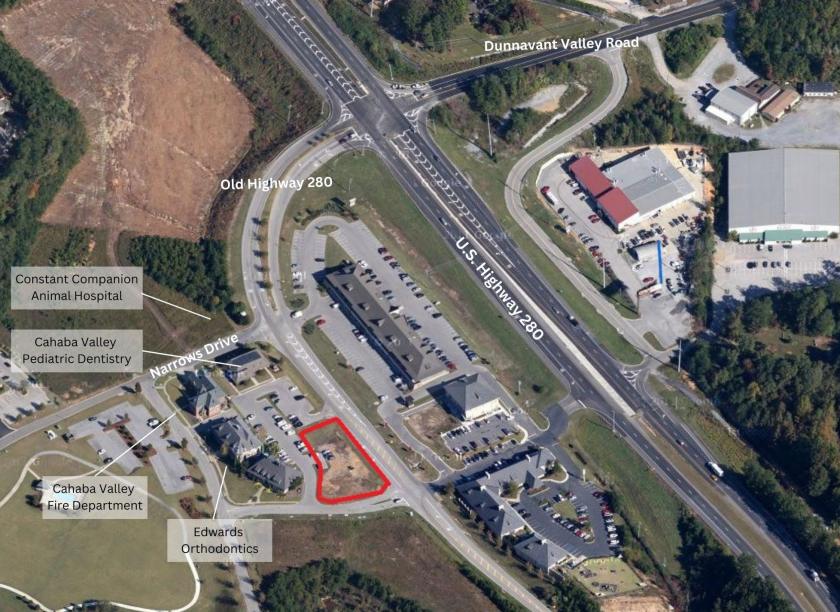
- • .46 acre commercial parcel
- • Established professional setting
- • Just off Hwy 280 at The Narrows community
Listing Agents

Bill Warren
O: 205-960-1787
bwarren@lahcommercial.com
O: 205-960-1787
bwarren@lahcommercial.com
While we strive to provide the most accurate information, all listing information, and demographic data, is provided by third-parties. As such, MyEListing will not be responsible for the accuracy of the information. It is strongly recommended that you verify all information with the listing agent, and any relevant agencies, prior to making any decisions.


