Multifamily Housing
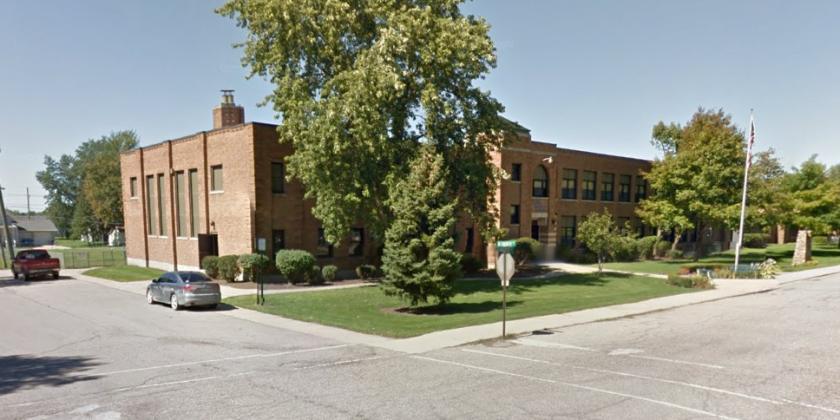
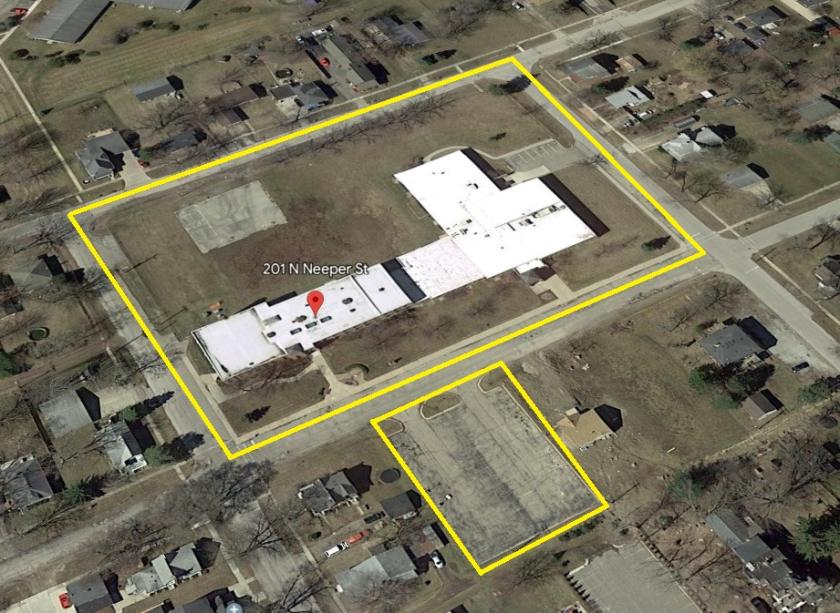
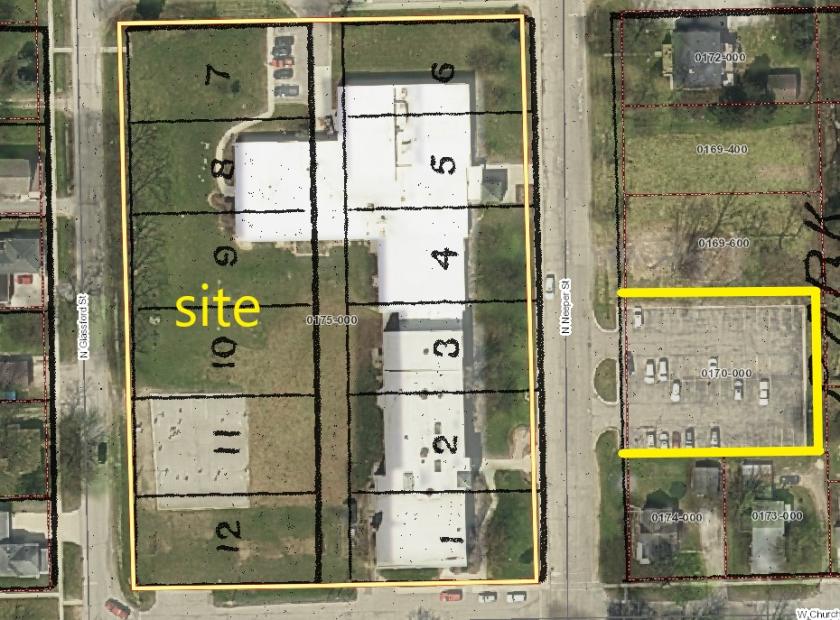
201 North Neeper Street Capac, MI 48014
201 North Neeper Street Capac, MI 48014
Details & Description
Property Highlights
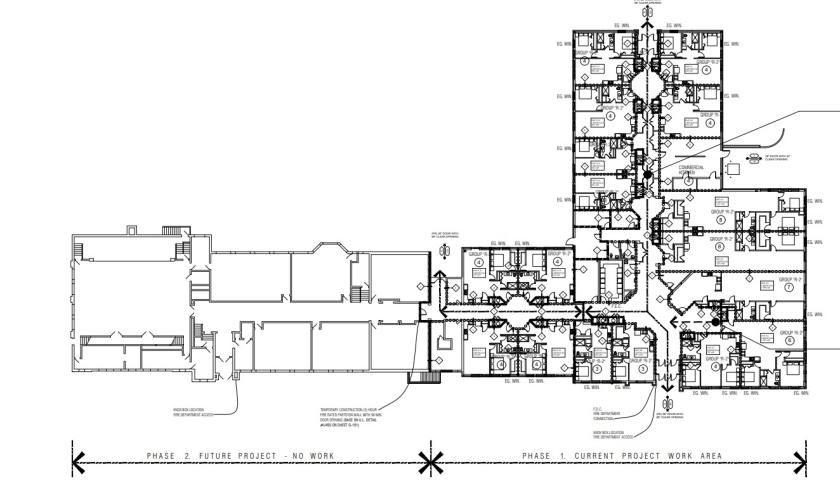
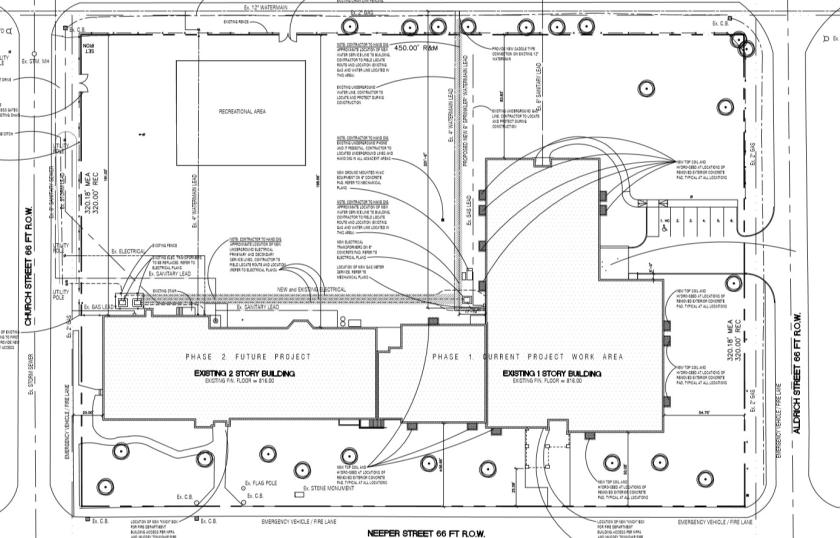
• Ready for permits for Phase 1 (18 Units)
• All Architectural included
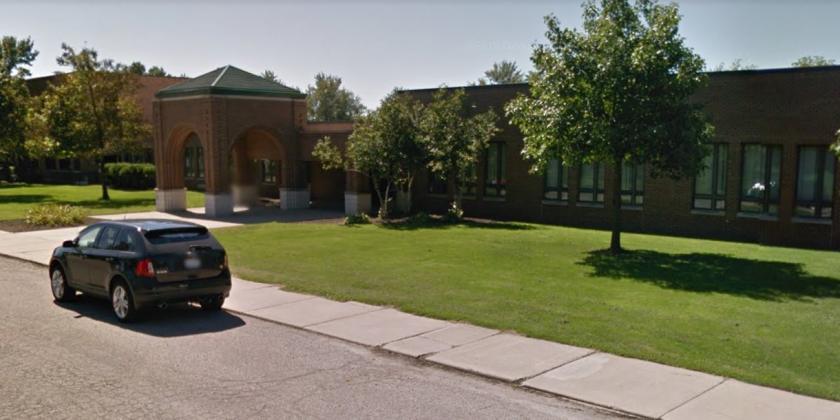
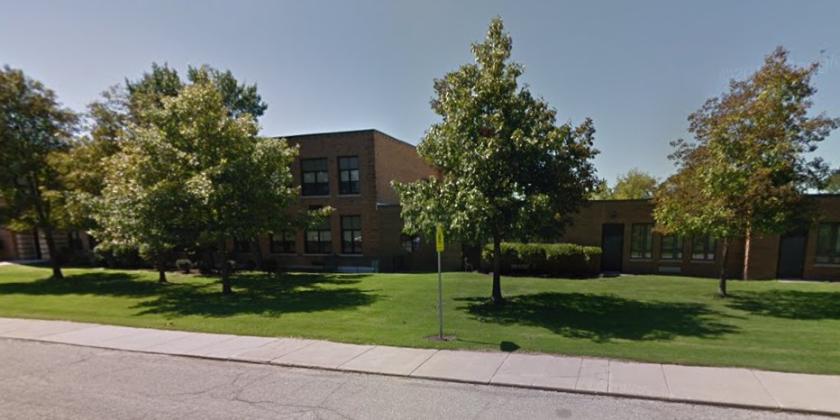
Additional Photos

Listing Agents

Robert Drewek
O: 586-263-5111
M: 586-995-7664
rob@linorealty.com
O: 586-263-5111
M: 586-995-7664
rob@linorealty.com
While we strive to provide the most accurate information, all listing information, and demographic data, is provided by third-parties. As such, MyEListing will not be responsible for the accuracy of the information. It is strongly recommended that you verify all information with the listing agent, and any relevant agencies, prior to making any decisions.