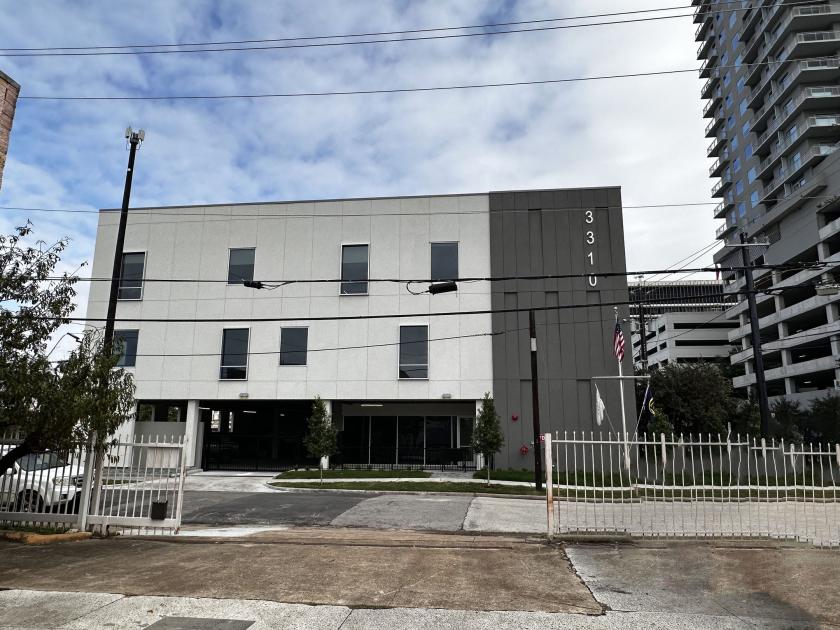
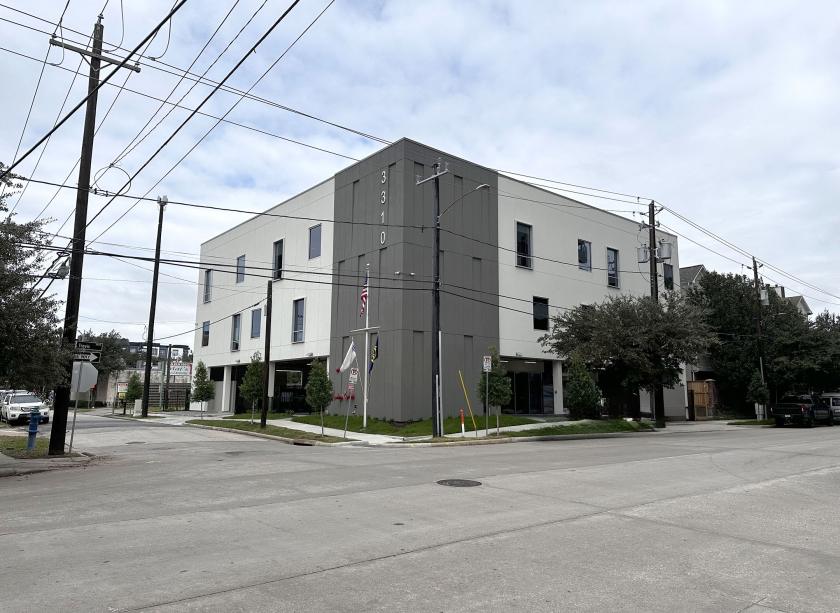
1-Mile | 3-Miles | 5-Miles | ||
---|---|---|---|---|
Total Population | 26,194 | 180,973 | 433,933 | |
Population Median Age | 36 | 37 | 37 | |
Population by Age | 0-9 Yrs | 1714 (6%) | 13219 (7%) | 44358 (10%) |
10-19 Yrs | 832 (3%) | 14240 (7%) | 38219 (8%) | |
20-29 Yrs | 8794 (33%) | 47657 (26%) | 93888 (21%) | |
30-39 Yrs | 6301 (24%) | 38690 (21%) | 83654 (19%) | |
40-49 Yrs | 2948 (11%) | 20608 (11%) | 53202 (12%) | |
50-59 Yrs | 2521 (9%) | 19094 (10%) | 47947 (11%) | |
60-69 Yrs | 1772 (6%) | 15892 (8%) | 40674 (9%) | |
70+ Yrs | 1312 (5%) | 11572 (6%) | 31991 (7%) | |
Median HH Income | $76,179 | $86,289 | $74,986 | |
Total Household Income | < 24K | 2660 (17%) | 13648 (16%) | 36793 (18%) |
25-49K | 2079 (13%) | 11094 (13%) | 31218 (16%) | |
50-74K | 2783 (18%) | 13026 (15%) | 29033 (14%) | |
75-99K | 1866 (12%) | 9870 (11%) | 20362 (10%) | |
100-199K | 3738 (24%) | 20691 (24%) | 41675 (21%) | |
200K+ | 2094 (13%) | 16121 (19%) | 34983 (18%) | |
Highest Education Level | No Diploma | 579 | 8361 | 36409 |
Diploma or GED | 1564 | 14913 | 43514 | |
Some College | 2663 | 17209 | 40429 | |
Assoc. Degree | 941 | 5961 | 13569 | |
Bachelors Degree | 7891 | 44718 | 92698 | |
Higher Degree | 6662 | 41437 | 86618 | |
Total Housing Units | 17,719 | 97,733 | 222,445 | |
--Owner-Occupied | 4,746 | 32,405 | 83,242 | |
--Renter-Occupied | 10,473 | 52,046 | 110,821 | |
Owner-Occupied Values | < 100K | 157 | 1060 | 10271 |
100-199K | 427 | 3420 | 11734 | |
200-299K | 817 | 4780 | 9356 | |
300-399K | 1139 | 6560 | 12177 | |
400-499K | 803 | 4083 | 9046 | |
500K+ | 1403 | 12502 | 30659 | |
Total Working Age Population | 24,065 | 161,843 | 368,317 | |
In Work Force | 19,388 | 109,311 | 248,247 | |
Not In Work Force | 4,677 | 52,532 | 120,070 | |
Workforce Employed | 18,433 | 103,859 | 235,215 | |
Workforce Unemployed | 955 | 5,309 | 12,823 | |
Civlian Workforce | 19,388 | 109,168 | 248,039 | |
Military Workforce | 0 | 143 | 208 | |
Total Households | 15,219 | 84,451 | 194,064 | |
Family Households | 4,078 | 32,044 | 89,947 | |
Non-Family Households | 11,141 | 52,407 | 104,117 | |
Married Couple | 3,160 | 24,633 | 65,495 | |
Other Family | 918 | 7,410 | 24,452 | |
Married w/Child | 690 | 7,014 | 23,322 | |
Single Male w/Child | 101 | 826 | 2,716 | |
Single Female w/Child | 340 | 2,119 | 7,943 |
Population Change Last Two Decades - Plus Projection
2000 | % | 2010 | % | 2020 | % | 2030 | |
---|---|---|---|---|---|---|---|
Texas | 20,851,820 | +21 | 25,145,561 | +18 | 29,677,668 | +18 | 34,894,452 |
Harris County | 3,400,578 | +20 | 4,092,459 | +22 | 4,978,845 | +19 | 5,924,750 |
Total Working Age Population:
Total Households:
Total Working Age Population:
Total Households:
Total Working Age Population:
Total Households: