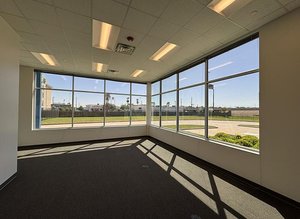
1-Mile | 3-Miles | 5-Miles | ||
---|---|---|---|---|
Total Population | 16,228 | 108,264 | 283,433 | |
Population Median Age | 33 | 34 | 34 | |
Population by Age | 0-9 Yrs | 2398 (14%) | 16954 (15%) | 44059 (15%) |
10-19 Yrs | 2640 (16%) | 16383 (15%) | 44316 (15%) | |
20-29 Yrs | 3071 (18%) | 17044 (15%) | 41795 (14%) | |
30-39 Yrs | 2633 (16%) | 16941 (15%) | 44305 (15%) | |
40-49 Yrs | 1435 (8%) | 13412 (12%) | 36620 (12%) | |
50-59 Yrs | 2178 (13%) | 12369 (11%) | 32332 (11%) | |
60-69 Yrs | 1086 (6%) | 8704 (8%) | 23857 (8%) | |
70+ Yrs | 787 (4%) | 6457 (5%) | 16150 (5%) | |
Median HH Income | $39,791 | $56,386 | $60,753 | |
Total Household Income | < 24K | 1920 (27%) | 7179 (18%) | 16532 (17%) |
25-49K | 2421 (34%) | 10120 (26%) | 22957 (23%) | |
50-74K | 1549 (21%) | 7324 (18%) | 17982 (18%) | |
75-99K | 449 (6%) | 4063 (10%) | 11874 (12%) | |
100-199K | 657 (9%) | 7706 (19%) | 20713 (21%) | |
200K+ | 111 (1%) | 2449 (6%) | 5838 (6%) | |
Highest Education Level | No Diploma | 994 | 8166 | 24998 |
Diploma or GED | 3013 | 16258 | 43110 | |
Some College | 2732 | 17131 | 43867 | |
Assoc. Degree | 922 | 6147 | 16924 | |
Bachelors Degree | 1206 | 12851 | 32219 | |
Higher Degree | 925 | 5905 | 14101 | |
Total Housing Units | 8,271 | 42,890 | 104,268 | |
--Owner-Occupied | 1,610 | 18,482 | 53,514 | |
--Renter-Occupied | 5,497 | 20,360 | 42,382 | |
Owner-Occupied Values | < 100K | 222 | 1047 | 5045 |
100-199K | 982 | 10018 | 28996 | |
200-299K | 396 | 5536 | 13952 | |
300-399K | 8 | 1170 | 3637 | |
400-499K | 2 | 442 | 1101 | |
500K+ | 0 | 269 | 782 | |
Total Working Age Population | 12,225 | 81,590 | 212,544 | |
In Work Force | 9,100 | 57,616 | 147,027 | |
Not In Work Force | 3,125 | 23,974 | 65,516 | |
Workforce Employed | 8,343 | 54,426 | 138,231 | |
Workforce Unemployed | 758 | 3,170 | 8,642 | |
Civlian Workforce | 9,100 | 57,596 | 146,874 | |
Military Workforce | 0 | 20 | 154 | |
Total Households | 7,106 | 38,842 | 95,896 | |
Family Households | 3,317 | 24,934 | 67,288 | |
Non-Family Households | 3,789 | 13,907 | 28,608 | |
Married Couple | 1,448 | 15,920 | 45,065 | |
Other Family | 1,868 | 9,014 | 22,222 | |
Married w/Child | 664 | 7,135 | 21,054 | |
Single Male w/Child | 178 | 1,118 | 2,554 | |
Single Female w/Child | 1,159 | 4,530 | 10,302 |
Population Change Last Two Decades - Plus Projection
2000 | % | 2010 | % | 2020 | % | 2030 | |
---|---|---|---|---|---|---|---|
Texas | 20,851,820 | +21 | 25,145,561 | +18 | 29,677,668 | +18 | 34,894,452 |
Harris County | 3,400,578 | +20 | 4,092,459 | +22 | 4,978,845 | +19 | 5,924,750 |
Total Working Age Population:
Total Households:
Total Working Age Population:
Total Households:
Total Working Age Population:
Total Households: