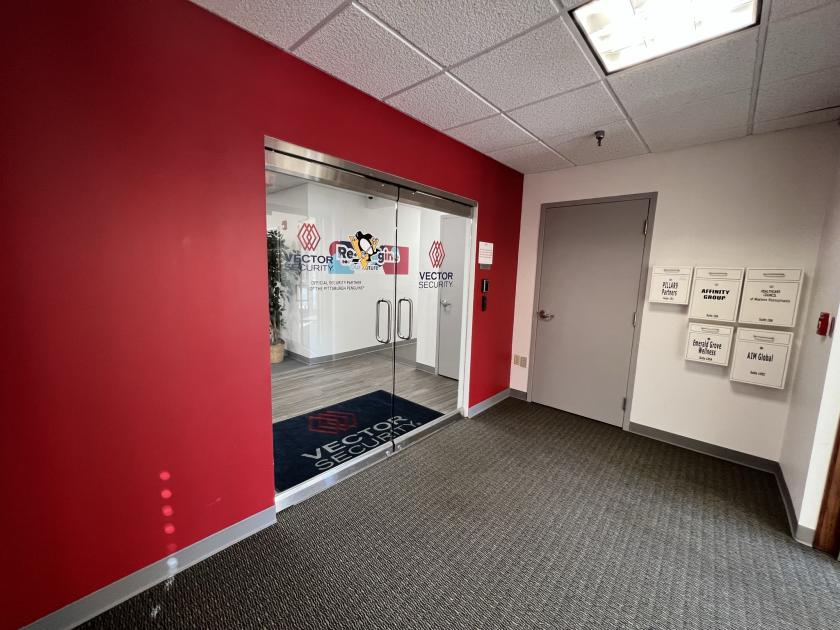
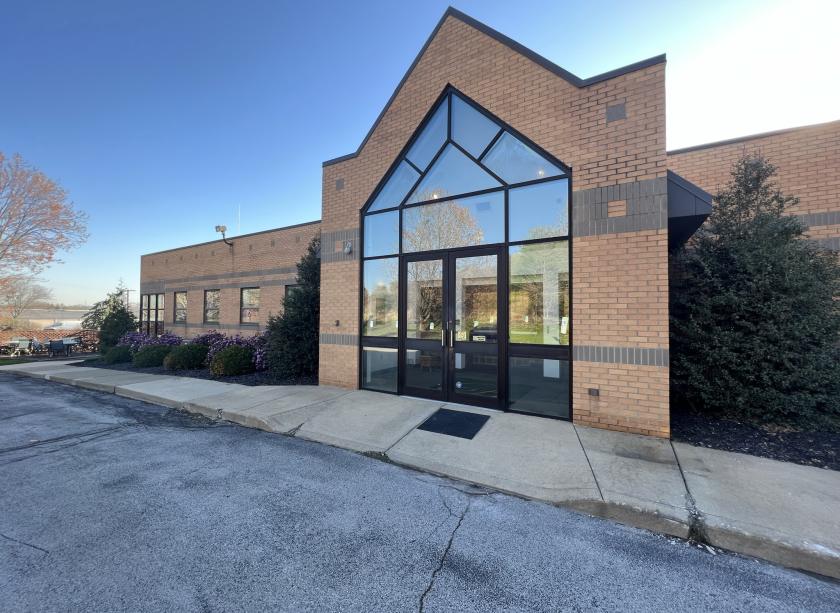
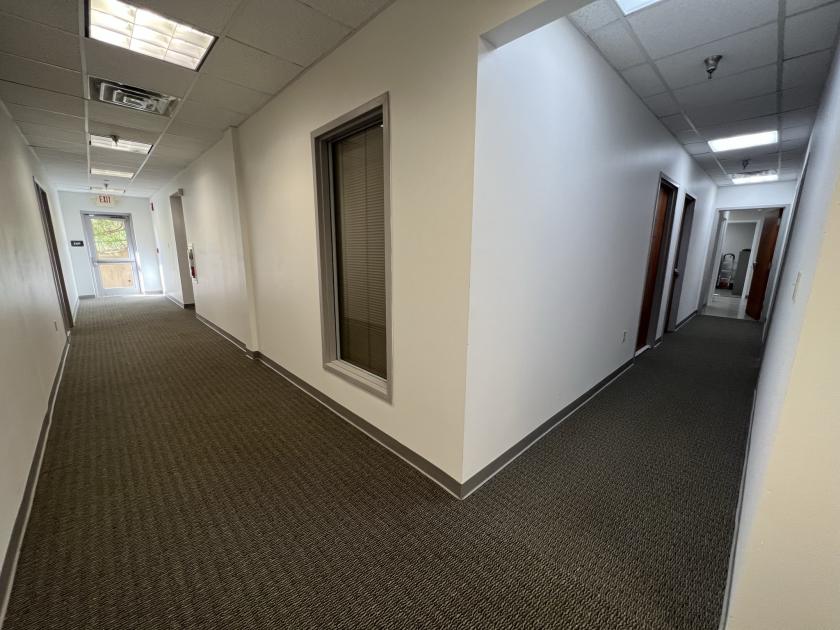
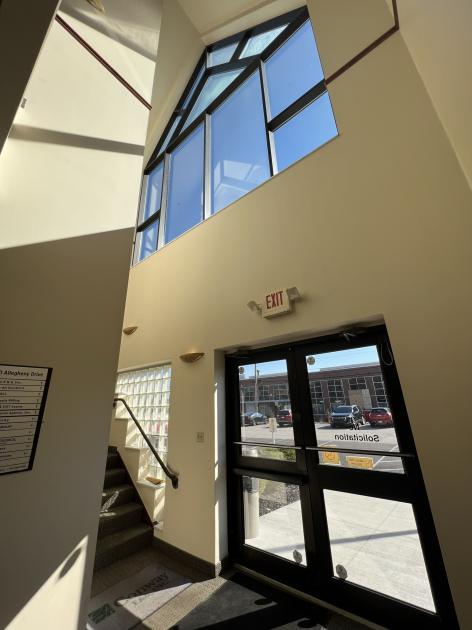
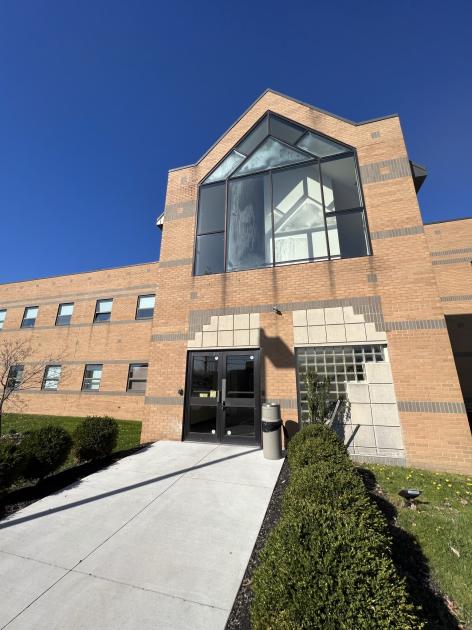
Office Space
100 Allegheny Drive Warrendale, PA 15086
100 Allegheny Drive Warrendale, PA 15086
Details & Description
Property Highlights
- • Ample Parking
- • Convenient Location
- • Suite Cleaning Included
- • Elevatored Building
- • 24 Hour Acces
- • Central Air Conditioning
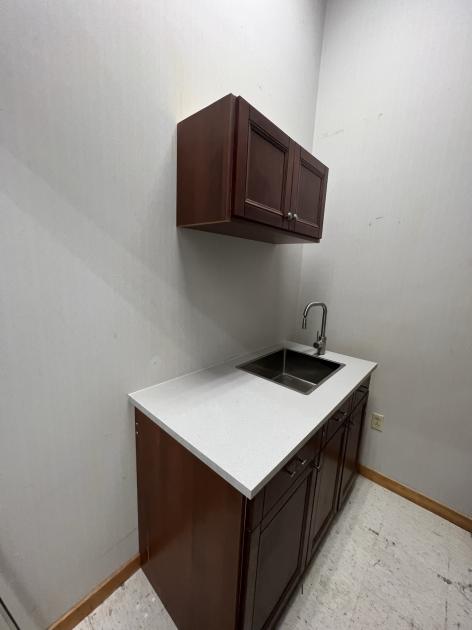
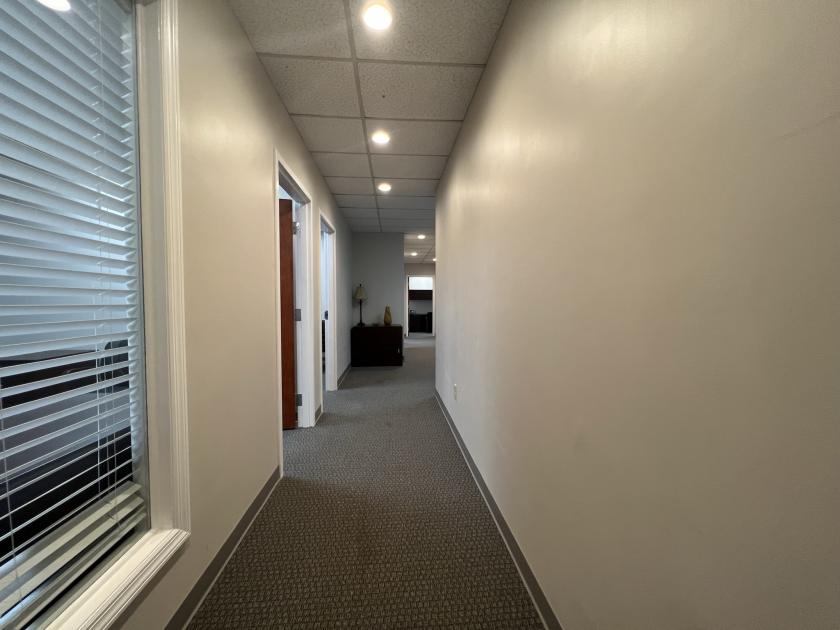
Additional Photos
Listing Agents

Jennifer Ryan Fitzpatrick
O: 412-366-5700
manager@amfmgmt.com
O: 412-366-5700
manager@amfmgmt.com
While we strive to provide the most accurate information, all listing information, and demographic data, is provided by third-parties. As such, MyEListing will not be responsible for the accuracy of the information. It is strongly recommended that you verify all information with the listing agent, and any relevant agencies, prior to making any decisions.