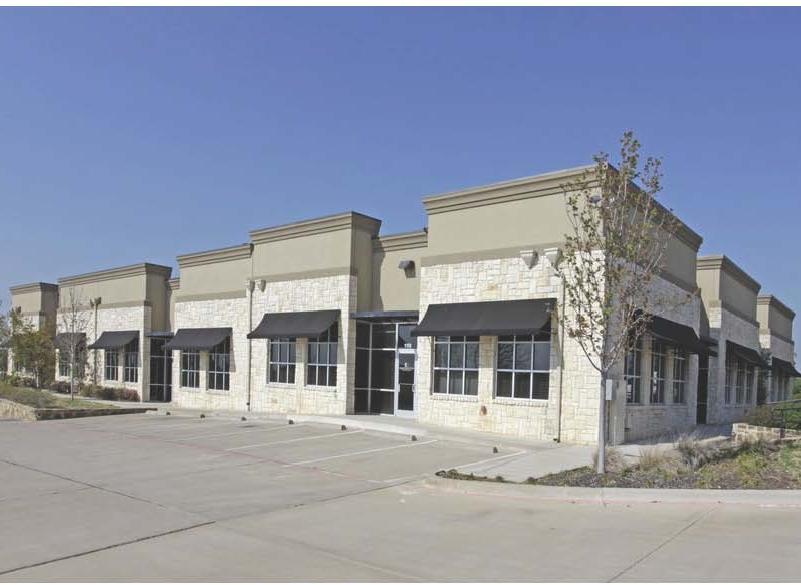
1-Mile | 3-Miles | 5-Miles | ||
---|---|---|---|---|
Total Population | 6,171 | 79,391 | 196,870 | |
Population Median Age | 36 | 36 | 36 | |
Population by Age | 0-9 Yrs | 674 (10%) | 9689 (12%) | 24297 (12%) |
10-19 Yrs | 1220 (19%) | 14411 (18%) | 34697 (17%) | |
20-29 Yrs | 637 (10%) | 9304 (11%) | 25266 (12%) | |
30-39 Yrs | 692 (11%) | 9764 (12%) | 25022 (12%) | |
40-49 Yrs | 1142 (18%) | 11817 (14%) | 28356 (14%) | |
50-59 Yrs | 874 (14%) | 10943 (13%) | 27384 (13%) | |
60-69 Yrs | 618 (10%) | 8124 (10%) | 19090 (9%) | |
70+ Yrs | 314 (5%) | 5338 (6%) | 12758 (6%) | |
Median HH Income | $122,277 | $92,213 | $88,093 | |
Total Household Income | < 24K | 86 (4%) | 2003 (8%) | 5405 (8%) |
25-49K | 117 (6%) | 3308 (13%) | 8896 (14%) | |
50-74K | 240 (13%) | 4166 (16%) | 11131 (18%) | |
75-99K | 266 (14%) | 4207 (16%) | 9941 (16%) | |
100-199K | 800 (43%) | 8611 (34%) | 19977 (32%) | |
200K+ | 312 (17%) | 2453 (9%) | 5927 (9%) | |
Highest Education Level | No Diploma | 189 | 4065 | 11634 |
Diploma or GED | 531 | 10421 | 27091 | |
Some College | 1156 | 12153 | 29451 | |
Assoc. Degree | 349 | 5149 | 12069 | |
Bachelors Degree | 1100 | 12584 | 29277 | |
Higher Degree | 567 | 5791 | 14852 | |
Total Housing Units | 1,845 | 25,798 | 63,978 | |
--Owner-Occupied | 1,600 | 19,419 | 47,427 | |
--Renter-Occupied | 222 | 5,329 | 13,850 | |
Owner-Occupied Values | < 100K | 77 | 814 | 2882 |
100-199K | 157 | 5786 | 17434 | |
200-299K | 608 | 7216 | 15815 | |
300-399K | 545 | 4142 | 7368 | |
400-499K | 166 | 981 | 2247 | |
500K+ | 46 | 481 | 1681 | |
Total Working Age Population | 4,691 | 61,155 | 152,770 | |
In Work Force | 3,487 | 41,946 | 107,004 | |
Not In Work Force | 1,204 | 19,209 | 45,766 | |
Workforce Employed | 3,327 | 40,232 | 101,982 | |
Workforce Unemployed | 118 | 1,618 | 4,725 | |
Civlian Workforce | 3,446 | 41,850 | 106,707 | |
Military Workforce | 41 | 96 | 297 | |
Total Households | 1,822 | 24,748 | 61,277 | |
Family Households | 1,603 | 19,795 | 48,718 | |
Non-Family Households | 219 | 4,953 | 12,559 | |
Married Couple | 1,375 | 15,494 | 36,767 | |
Other Family | 228 | 4,301 | 11,951 | |
Married w/Child | 678 | 7,556 | 16,902 | |
Single Male w/Child | 9 | 288 | 1,212 | |
Single Female w/Child | 125 | 1,680 | 4,474 |
Population Change Last Two Decades - Plus Projection
2000 | % | 2010 | % | 2020 | % | 2030 | |
---|---|---|---|---|---|---|---|
Texas | 20,851,820 | +21 | 25,145,561 | +18 | 29,677,668 | +18 | 34,894,452 |
Johnson County | 126,811 | +19 | 150,934 | +14 | 171,701 | +13 | 194,098 |
Tarrant County | 1,446,219 | +25 | 1,809,034 | +19 | 2,143,755 | +17 | 2,507,170 |
Total Working Age Population:
Total Households:
Total Working Age Population:
Total Households:
Total Working Age Population:
Total Households: