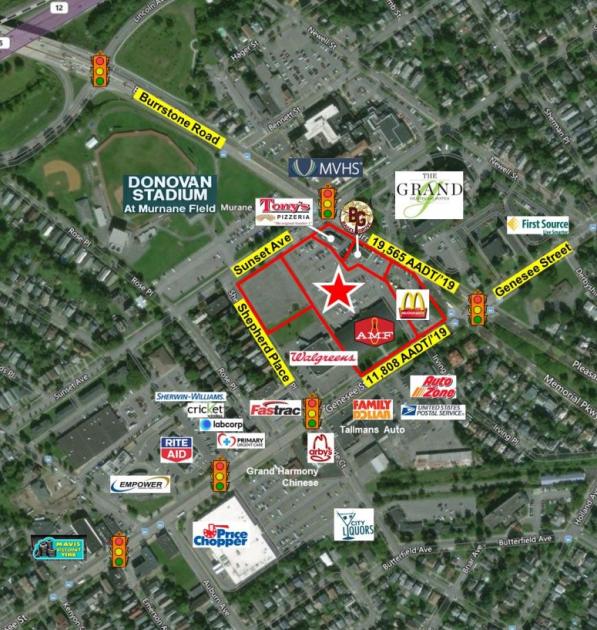
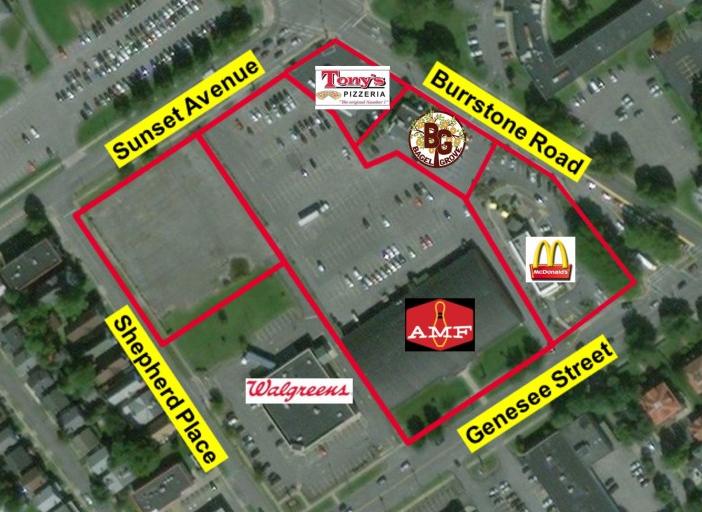
By signing in, you agree with: Terms & Conditions, Privacy Policy and Copyright


Multiple building assemblage with existing investment income and additional acreage for development. Offering consists of 1700 Genesee Street (McDonald's), 1724 Genesee Street (AMF Pin-O-Rama Bowling), 7 Burrstone Road (Bagel Grove), 23 Burrstone Road (Tony's Pizzeria), and a 1.31+/- vacant lot on Sunset Avenue totaling 25,658+/- SF on 6.58+/- acres. Please contact James Dylan Furney (315) 225-8571 or Jeffrey D'Amore (315) 725-3510 for more information.
| Month | Payment | Principal | Interest | Total Interest | Balance |
|---|---|---|---|---|---|
| $0.00 | $0.00 | $0.00 | $0.00 | $0.00 | $0.00 |
All information based on the most recently available data (updated annually) and is provided in 1-mile, 3-mile, and 5-mile radii (radiuses) of the property location.
| Total Population | 19,353 | 71,955 | 102,833 | |
| Population Median Age | 35 | 38 | 40 | |
| Population by Age | 0-9 Yrs | 2987 (15%) | 9449 (13%) | 12234 (11%) |
| 10-19 Yrs | 2900 (14%) | 10770 (14%) | 14050 (13%) | |
| 20-29 Yrs | 3290 (16%) | 10592 (14%) | 14667 (14%) | |
| 30-39 Yrs | 2687 (13%) | 8736 (12%) | 12048 (11%) | |
| 40-49 Yrs | 1928 (9%) | 8294 (11%) | 12119 (11%) | |
| 50-59 Yrs | 2190 (11%) | 8476 (11%) | 13017 (12%) | |
| 60-69 Yrs | 1799 (9%) | 7472 (10%) | 11291 (10%) | |
| 70+ Yrs | 1572 (8%) | 8166 (11%) | 13408 (13%) | |
| Median HH Income | $36,274 | $46,217 | $52,583 | |
| Total Household Income | < 24K | 2455 (35%) | 7926 (28%) | 9607 (23%) |
| 25-49K | 1794 (26%) | 6824 (24%) | 9758 (24%) | |
| 50-74K | 1027 (15%) | 4826 (17%) | 7522 (18%) | |
| 75-99K | 559 (8%) | 2852 (10%) | 4568 (11%) | |
| 100-199K | 792 (11%) | 3888 (14%) | 7386 (18%) | |
| 200K+ | 199 (2%) | 1190 (4%) | 1702 (4%) | |
| Highest Education Level | No Diploma | 2646 | 7568 | 8796 |
| Diploma or GED | 3061 | 13181 | 19166 | |
| Some College | 2284 | 8340 | 12699 | |
| Assoc. Degree | 1138 | 5018 | 8010 | |
| Bachelors Degree | 1523 | 6777 | 11102 | |
| Higher Degree | 864 | 5096 | 8663 | |
| Total Housing Units | 8,053 | 32,944 | 46,971 | |
| --Owner-Occupied | 2,902 | 15,120 | 24,832 | |
| --Renter-Occupied | 3,924 | 12,386 | 15,712 | |
| Owner-Occupied Values | < 100K | 1747 | 5989 | 8474 |
| 100-199K | 671 | 6028 | 10571 | |
| 200-299K | 210 | 1442 | 3046 | |
| 300-399K | 20 | 594 | 1279 | |
| 400-499K | 90 | 311 | 478 | |
| 500K+ | 164 | 756 | 985 | |
| Total Working Age Population | 14,794 | 56,395 | 82,626 | |
| In Work Force | 8,439 | 32,581 | 48,735 | |
| Not In Work Force | 6,355 | 23,814 | 33,891 | |
| Workforce Employed | 7,692 | 30,494 | 46,147 | |
| Workforce Unemployed | 711 | 2,019 | 2,490 | |
| Civlian Workforce | 8,403 | 32,513 | 48,637 | |
| Military Workforce | 36 | 68 | 99 | |
| Total Households | 6,826 | 27,506 | 40,544 | |
| Family Households | 3,751 | 16,404 | 24,773 | |
| Non-Family Households | 3,075 | 11,102 | 15,771 | |
| Married Couple | 1,908 | 9,760 | 16,346 | |
| Other Family | 1,844 | 6,644 | 8,427 | |
| Married w/Child | 775 | 3,891 | 6,087 | |
| Single Male w/Child | 252 | 673 | 978 | |
| Single Female w/Child | 767 | 2,875 | 3,355 | |
Population Change Last Two Decades - Plus Projection
| 2000 | % | 2010 | % | 2020 | % | 2030 | |
|---|---|---|---|---|---|---|---|
| New York | 18,976,457 | +2 | 19,378,102 | +4 | 20,146,131 | +2 | 20,604,030 |
| Herkimer County | 64,427 | 0 | 64,519 | -4 | 61,970 | -3 | 60,367 |
| Oneida County | 235,469 | 0 | 234,878 | -2 | 230,608 | -1 | 227,622 |